The concept of "profitability" refers to the field of business and economics and is used to find out how efficiently a commercial organization operates. By analyzing this indicator, a manager or business owner can understand what is happening with his company, whether it is profitable or unprofitable, what its prospects are and whether it is worth investing in its development. What is profitability, why is it needed and how is it calculated, you will learn from our article.
Why calculate profitability?
The financial profitability of a project is often a key indicator in analyzing a company's performance. In simple terms, by calculating the real profitability, you can understand how well the funds invested in the project pay off.
And we must not forget that profitability as an indicator is extremely important in a project that has not even begun to operate. Any startup will be judged by its estimated (based on numbers and analysis) profitability. And not only when it comes to investor valuation. An entrepreneur drawing up a business plan must evaluate how profitable his business will be in order to understand whether something needs to be changed, or whether it may not be worth investing resources at all.
This indicator is calculated as a numerical coefficient - the higher the number, the greater the profitability of the company.
There are several main reasons to calculate profitability, in addition to what we have already mentioned:
- To be able to predict the profit of the next period.
- To be able to compare performance with competitors.
- To be able to justify the investment. This is especially important when a third party is involved in the transaction, who invests their money with the aim of making a profit in the future.
- To determine the real market value of the company. Often used in preparation for sale.
Dynamics and coefficients
As for the dynamics, today in Russia it is below average. This may be due to insufficient adoption of technological innovations, improved methods and entry into larger markets.
Here a kind of vicious circle arises when the insufficient quality of the products produced due to the small number of technological improvements creates a low attractiveness of the product. Thus, we can conclude that in order to increase the level of profitability of both a specific enterprise and the industry as a whole, a set of measures aimed at comprehensive improvement is necessary.
Enterprise profitability
Once again, in simple words, we will define what profitability is for a company and why it is needed:
The profitability of an enterprise is one of the main economic indicators that can show the profitability of a company from its activities (or an entrepreneur). Calculating profitability will show how justified and profitable a project or line of activity is.
You need to understand that the economic activity of a company involves a lot of different resources - labor, economic, financial, natural. The use of each of them must be justified from the point of view of economic feasibility. That is, they all must generate income, or a result that will lead to an increase in income.
By assessing profitability, you can understand which resources are not bringing the desired result and adjust their use.
To put it even more simply, profitability is the ratio between the costs of the production process and the profit received as a result.
If a business has made a profit over a certain period of time, then it is called profitable. And accordingly – beneficial for the owner.
Answer
The main indicator of the company, which is closely monitored by controllers, is the tax burden. That is, the auditors want to know what share of your income you give to the state. They themselves explain that it is necessary to correlate the amount of taxes paid with revenue using the formula: Amount of taxes paid during the year: Amount of revenue for the year (excluding VAT) * 100%. Safe indicators of the tax burden and profitability for 2012 for common types of activities are sent to you in the response materials.
The rationale for this position is given below in the materials of the Glavbukh System version for commercial organizations
1. Article: How to calculate the tax burden and profitability to find out whether to wait for an audit
Tax officials, when selecting candidates for an on-site audit, use the criteria listed in Appendix No. 2 to the order of the Federal Tax Service of Russia dated May 30, 2007 No. MM-3-06 / [email protected] Among them are indicators of the tax burden and profitability. Every year, industry average values for them are updated on the website of the Federal Tax Service of Russia in the “Control work” section. We also provided data on profitability and tax burden for 2012 in the table below.
Safe indicators of tax burden and profitability for 2012 for common types of activities*
Type of economic activity
The tax burden, %
Return on assets, %
Return on sales, %
Agriculture, hunting and forestry
Profitability Factors
Many factors influence profitability. And you need to be familiar with them in order to understand how this process develops and how it can be calculated.
Experts distinguish exogenous and endogenous factors.
Exogenous factors of profitability
Exogenous (arising under the influence of something outside) include, for example, state tax policy. Because the company’s expenses on mandatory payments directly affect the company’s profitability. Also, exogenous factors include the geographical location of the enterprise, the general level of competition in the market, the political situation in the country, market conditions and other factors.
Endogenous (internal) factors
It is clear that, unlike exogenous ones, these factors appear within the company itself. For example, the working conditions of personnel directly affect the quality of products.
The company's logistics system has a direct impact on the company's expense items and the work of the marketing department. And in general, the financial and managerial activities of management also have something to do with all this.
There are a lot of nuances. Almost every action of the company affects other processes in one way or another. And to understand, you need to carry out analysis.
Factor analysis of firm profitability
Just in order to understand which factors influence what, factor analysis is carried out. Using it, you can determine the exact amount of the company’s income, which was received under the influence of endogenous factors. There are special formulas for determining:
Profitability = (Profit from sales of product or services / Cost) * 100%
There is another formula:
Profitability = ((Price of product or service – Cost) / Cost)) * 100%
The classic version of the analysis uses either three or five factors. For three-factor analysis, you need to take product profitability, capital intensity, and capital turnover.
For five-factor analysis, labor intensity, material intensity, depreciation, and capital turnover are used.
Due to the fact that during the analysis all factors are divided into quantitative and qualitative indicators, specialists are able to see the development of the company from different sides.
But for a better understanding, let’s first understand what types of profitability exist.
Average profitability by industry 2021
Return to Profitability 2017
The Federal Tax Service publishes average profitability indicators on its official website.
So, today the current figures are the following values:
— wholesale trade – 10.5% — retail trade – 3.6% — construction – 6.7%
Profitability indicators by industry should be taken into account when assessing the risk of a tax audit of your organization. When conducting on-site tax control, inspectors quite often pay attention specifically to the organization’s profitability statistics, so this criterion can also be used by taxpayers who want to adjust the results of their financial and economic activities in order to reduce the risk of coming to the attention of tax inspectors. A significant deviation is considered to be profitability that differs by more than 10% from the indicators of similar industries and organizations.
We should also not forget about such a criterion as a relatively low tax burden, which is noticeably lower than the average level for all business entities in a certain industry.
This can also attract increased attention from tax authorities.
Average profitability
When calculating profitability, you need to obtain two important accounting indicators: return on assets and return on sales. Then the obtained figures must be compared with the average level of profitability for your type of activity (main). Industry profitability is always indicated in special directories that are regularly published by Rosstat.
To calculate the profitability of sales, it is necessary to take the ratio of the balanced financial result from sales to the cost of products sold (x100%).
Experts consider the following to be significant factors influencing the amount of profitability:
— change in the cost of raw materials; — level of qualification of the workforce; — the markup is too small or large; — presence or absence of discounts; — influence of competition, etc.
Average profitability and tax burden
Many are familiar with the concept of assessing the risk of a tax audit, as well as the dependence of the magnitude of this risk on factors such as the size of the tax burden, almost equal amounts of income and expenses of the organization, or payment of salaries, the size of which is below the national average. Among these factors is the profitability indicator in the enterprise statistics. It is no secret that if it seriously deviates from the level of profitability calculated by the Ministry of Finance for a given area of activity, this will inevitably entail an inspection by the Federal Tax Service.
Profitability by type of activity
The Federal Tax Service publishes average profitability indicators on its official website.
So, today the current figures are the following values:
— wholesale trade – 10.5% — retail trade – 3.6% — construction – 6.7%
Profitability indicators by industry should be taken into account when assessing the risk of a tax audit of your organization. When conducting on-site tax control, inspectors quite often pay attention specifically to the organization’s profitability statistics, so this criterion can also be used by taxpayers who want to adjust the results of their financial and economic activities in order to reduce the risk of coming to the attention of tax inspectors. A significant deviation is considered to be profitability that differs by more than 10% from the indicators of similar industries and organizations.
We should also not forget about such a criterion as a relatively low tax burden, which is noticeably lower than the average level for all business entities in a certain industry. This can also attract increased attention from tax authorities.
Types of profitability
You need to understand that profitability indicators may differ depending on the area in which the enterprise operates. Therefore, economists usually distinguish three groups:
Profitability of products and services. Here the main role is played by the funds spent on the project, as well as the profit from it. It is calculated both for the entire company and for a specific product or service.
Enterprise profitability. Here you can find many different indicators, each of which will, from one side or another, characterize the processes occurring in the company. An assessment of this type of profitability is needed to evaluate the performance of the entire project by investors or owners.
Return on assets. There is also a large set of different indicators that can reflect the appropriateness of a company’s use of a specific resource. So, for example, an entrepreneur can see how rationally it is to use credit funds, their own investments, or other assets.
As a rule, profitability is analyzed not only for internal needs. This is an important stage when preparing a project for presentation to an investor or lender. It is also used in preparing a business plan to obtain sponsorship.
How to increase profitability - methods that work
If profitability indicators are low or even negative and do not suit business owners and investors, there are ways to improve the company’s performance:
- Increasing production capacity - by purchasing new or improving existing equipment, production volume increases and profits increase. The use of the latest technologies in equipment increases labor productivity and saves labor resources.
- Improving the quality of goods leads to increased consumer demand and increased sales.
- Reducing production costs - you need to find suppliers offering to supply raw materials or goods for resale on favorable terms. At the same time, the reduction in cost should not affect the quality of goods.
- Developing and improving a company's marketing policy is a useful tool for increasing sales and profitability. A successful marketing strategy dramatically changes the life of a company and brings in hundreds, if not thousands, of customers. For example, she created a soda machine that asks for a hug; for hugging the machine, a person received a can of the drink for free. This marketing campaign increases customer loyalty to the company, which brings real money and increases profitability.
Promotion and advertising tools are very different: promotions, discounts, competitions, coupons, free distribution of product samples. You can use social networks or banners, create a recognizable trademark or brand. Developing your own product that interests the buyer guarantees good profits.
Profitability calculation
The largest indicator is, of course, the profitability of the entire company. To calculate it, accounting and statistical documents for one period are usually used.
A simplified version of the calculation looks like this:
P = BP / SA * 100%
P – profitability of the enterprise
BP – balance sheet profit. It is calculated by subtracting the cost of the product from the revenue received. But this is done before taxes!
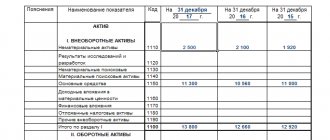
CA is the total value of all assets, both current and non-current, as well as production facilities and resources. The data is taken from the balance sheet.
If, according to the results of the analysis, profitability is low, then the entrepreneur should urgently take action. It may be necessary to adjust production costs, or reconsider the methods used by management, or perhaps find a different supplier.
Return on assets (ROA)
The previous analysis showed the full picture. But it is impossible to do this without a preliminary analysis of the efficiency of asset use. Because their use directly affects the profit of the entire enterprise.
If after analysis the result shows that the indicator is low, then we can conclude that capital, as well as other assets, are performing poorly. More precisely, not enough. But a high indicator will indicate that the company is using the right tactics.
ROA shows the financial return of the entire project. Therefore, such analysis must be carried out frequently. This will make it possible to understand which of the objects is not generating adequate profit, to take action - to modernize it, or to abandon its use altogether.
The formula here is simple:
ROA = P / A P – profit for the entire time period used for analysis A – average value by type of asset for the same period
One of the most necessary and indicative coefficients. If the result is less than zero, this will mean that the company is operating at a loss.
Return on fixed assets (ROFA)
Fixed assets usually include the means of labor that are used in the operation of the company. The period of use of such funds should not be more than 12 months, and the amount of depreciation should be included in the calculation of the cost of the product or service. To make it clearer, here are examples of such tools:
- Buildings, structures where your workshops, warehouses, offices, etc. are located.
- Equipment that produces goods.
- Transportation vehicles – forklifts, heavy trucks.
- Furniture from the office or work furniture.
- Other transport.
- Expensive instrument.
The formula for calculation is as follows:
R = (PE / OS) * 100% PE – net profit OS – cost of fixed assets
This indicator plays a big role in commercial enterprises, giving them an idea of the profit per ruble of invested funds.
The coefficient should not fall below zero. If this happens, something needs to be changed, because the company is operating at a loss and is using fixed assets irrationally.
Return on Products Sold (ROM)
The formula for calculating this indicator is also simple:
ROM = Net profit / cost
The value of this indicator can demonstrate how much each invested ruble can bring.
The calculation scheme is simple:
- First you need to determine the time period for which the analysis will be carried out. Usually a period of one month to one year is taken.
- Next comes the calculation of all profits received from sales. To do this, income is added up.
- Next, net profit is determined.
- The last step is to apply the ROM formula.
To improve the efficiency of the analysis, you can compare such profitability indicators for several periods at once. This will give an understanding of how efficiently the company operates.
Return on Sales (ROS)
This indicator is intended to reflect the percentage of total revenue that accounts for the profit of the enterprise.
Formula for calculation:
ROS = (Profit / Revenue) * 100%
Various types of profit are used for calculation, depending on the company. It all depends on the product range, field of activity and many other parameters.
Return on sales is also often called profit margin. Since it shows the share of profit in total revenue.
Comparing this indicator over different periods of time is also a useful tool for understanding the dynamics of growth or decline in a company's performance.
If we consider the short-term period, it is worth isolating the operating profitability of sales. The formula for this is:
Operating return on sales = (Profit before taxes / Revenue) * 100%
The higher the value, the better the company performs, and the more profit its owner receives.
Profit margin
If you want to know how profitable your project is, calculate this indicator. You also need to understand that without calculating it, for example, it is impossible to draw up a high-quality business plan.
Formula:
R = VP / V VP – gross profit (revenue received minus cost). B – sales revenue
Return on Personnel (ROL)
This is a relative indicator. But no less important. In fact, everyone has long understood how important the element of labor management is in a company’s activities. Because it affects the entire production as a whole. And in order to effectively manage personnel, you need to track the number, level of training, skills, proficiency, advanced training of each, etc.
Formula:
ROL = PE / ChSH PE – net profit CHSh – number of personnel
For a more detailed analysis, the ratio of employee maintenance costs to net profit is calculated. The profitability of one employee is also checked. This is done by dividing the costs that go into its maintenance by the share of profit that it brings to the company.
Such calculations can show the state of labor management, reveal weak and strong points, and indicate the need to reduce or expand staff.
It is especially important to calculate this indicator for small enterprises so that calculations can be more effectively optimized.
Profitability threshold
This term means the minimum amount of sales at which the proceeds from these sales will cover all costs of production and bringing the product/service to the consumer. But profit is not taken into account here.
Such an indicator can help an entrepreneur plan the number of sales he will need to make in order to operate without a loss.
This indicator is often called the break-even point, or the critical point (not to be confused with the point of reaching net profit!)
You can read more about this in the material Break-even point.
Formula for calculation:
PR = PP / Kvm PR - profitability threshold PR - fixed costs for the production of goods / services and for their sale
Kvm – gross margin coefficient. You can calculate it using another formula:
Kvm = (V – Zpr) * 100% V – revenue Zpr – sum of variable costs
Criteria such as the price for the product, as well as any variable and fixed costs of the company, are of great importance for this indicator. About them - also in the article Break-even point.
Official figures
It is necessary to consider official indicators taking into account industry, regional and time factors.
Revenue and EBITda margin (earnings before interest and taxes), which actually reflects the amount of profit from sales before interest and taxes in each ruble, varied as follows from 2012 to 2015:
- 2012 – 1.8 billion rubles. industry average.
- In 2013 – 4.8 billion.
- In 2014 – 4 billion.
- And in 2015 about 8 billion.
By industry
Considering the level of profitability in various industries and activities in Russia, in accordance with the data sources used by Rosstat, here are the parameters and ratios that were demonstrated for 2015-2016:
- Communications and other services showed a negative trend of approximately -8%.
- Governance and state security were also in the red with Fr.
- Financial activities showed an insignificant increase of 0.2%.
- Hotels and restaurants increased the figure by 1.7%.
- Construction is about 3% in the black.
- Education is about 4% in positive dynamics.
- Wholesale and retail trade is just over +6%.
- Health care, pharmaceuticals and social services grew slightly more than 7%.
- Electricity and supply, as well as gas by 8%.
- Positive dynamics were also noted in the real estate and rental markets. Here the figure was more than 10%.
- Transport and communications were also in positive territory with a mark of 10.9%.
- Positive growth was also demonstrated by manufacturing industries – an increase of up to 11%.
- Oddly enough, agriculture and forestry showed a positive trend of 19%.
- Mining showed a profitability of 20%.
- But fishing and fish farming are in the black by almost 80%.
By region
As for regional indicators, here is what the statistics look like:
- Yakutia is in the black by 46.08%.
- Chukotka Autonomous Okrug, Murmansk Region, Kalmykia and Sakhalin are increasing production costs in the range from 30% to 40%.
- Nenets Autonomous Okrug, Krasnoyarsk Territory, Tyva, Kamchatka Territory, Magadan Region, Yamalo-Nenets Autonomous Okrug, Irkutsk Region - more than 20%
- Orenburg, Tyumen, Vologda, Kursk, Leningrad, Lipetsk, Belgorod, Chelyabinsk, Amur, Novgorod, Samara, Tula, Kemerovo, Arkhangelsk, Ryazan, Orel, Vladimir, Sverdlovsk regions, Khanty-Mansi Autonomous Okrug, Perm Territory, Buryatia, Karelia, Udmurtia , Tatarstan, Trans-Baikal Territory, Khakassia, Primorsky Territory - in the range from 10% to 20%.
- Tambov, Omsk, Krasnodar Territory, Bashkortostan, Bryansk - from 9% to 10%
- Bryansk, Kostroma, Komi Republic, Yaroslavl, Stavropol Territories - average profitability at 9%.
- Khabarovsk Territory, Chuvashia, Astrakhan, Tomsk regions - 8%.
- Sevastopol, Saratov, Penza, Voronezh, Kaliningrad, Volgograd, Rostov regions and Mari El - 7%.
- Altai Territory, Kirov, Nizhny Novgorod, Moscow, Kurgan regions and Karachay-Cherkessia - 6%.
- Smolensk, Novosibirsk, Ulyanovsk regions, as well as Adygea, Mordovia and St. Petersburg - 5%.
- Moscow and Pskov regions – 4%.
- Tver, Ivanovo, Kaluga regions - 3%.
- North Ossetia, Crimea, Kabardino-Balkaria – 2%.
- Dagestan and the Altai Republic were in the red with an average of -0.3%.
- Even lower figures are in Chechnya, Ingushetia and the Jewish Autonomous Region, where negative balances range from -5 to almost -9%.
On years
Assessing the dynamics of the financial results of the entire set of organizations that operated on the territory of the Russian Federation in a certain period of time, here are some general indicators that can be cited:
- In 1995, the share of profitable organizations was 65.8%.
- In 2000 – 60.2%.
- In 2005 – 63.6%.
- In 2010 – 70.1%.
- In 2015 – 67.4%.
- In 2021 – 70.5%.
- 2017 showed a mark of 68.1%.
- 2018 increased the figure to 72.6%.
If we consider the balance of profits and losses of an organization without small businesses in the Russian Federation, then here are the indicators by type in billions of rubles given by the Federal Statistics Service:
- 2005 – 1350 rub.
- 2006 – 1420 rub.
- 2007 – 1750 rub.
- 2008 – 620 rub.
- 2009 – 1600 rub.
- 2010 – 1800 rub.
- 2012 – 1900 rub.
- 2014 about 2200 rub.
- 2016 about 5500 rub.
- 2017 about 6000 rub.
- 2018 about 13,500 rub.
Norms
From the perspective of the enterprise’s functioning, a level of profitability that takes into account:
- The total burden of income taxes.
- VAT accounting.
Thus, for the manufacturing sector, 3% is considered low. For trade enterprises, the unsatisfactory level is 1%.
Project profitability
Every entrepreneur strives to increase the scale of his business in order to increase capacity, develop and ultimately make more profit. Assessing profitability at each stage can show whether development is moving in the right direction and what indicators require adjustment and intervention.
Most often, several methods are used to calculate profitability:
- A method that allows you to calculate net present value, which will help determine the net profit from a project.
- The method used to calculate the profitability index. Used when you need to know the ratio of costs and income.
- A method that calculates the marginal efficiency of capital (internal rate of return). Used to calculate the possible level of capital expenditure for a new project.
Formula:
IRR = (net present value / initial investment amount) * 100%
Purposes for which the calculation is used:
- Determine the costs if the project is carried out using funds raised.
- Confirm the profitability and benefits of the project.
If a bank loan is taken out to implement a project, then calculating the internal rate of return will show what the maximum allowable interest rate will be. Anything above this value indicates that the course taken is unprofitable.