What is return on total capital?
Return on total capital is a financial indicator that reflects how profitable investments in its assets are for an enterprise. Moreover, these investments are formed at the expense of total capital - both own and borrowed. This is precisely why the indicator under consideration is called “return on total capital”.
To calculate return on total capital, you need to use the formula:
RSK = F2300 / BSR1600,
where: RSC - return on total capital;
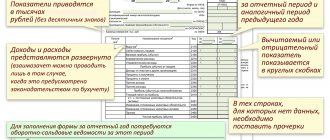
F2300 - line 2300 of the financial results report (profit before tax).
The BSR1600 indicator is defined as:
BSR1600 = (B1600 (NP) + B1600 (KP)) / 2,
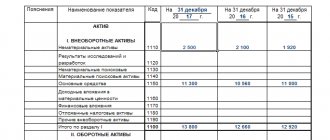
where: B1600 (NP) - indicator in line 1600 of the balance sheet (all assets) at the beginning of the period;
B1600 (KP) - indicator in line 1600 at the end of the period.
Return on total equity is very similar to return on assets.
Let's study its features.
What does WACC show and where is it used?
weighted average cost of capital indicator is used to carry out analysis in the following main areas:
- Discount rate for calculating other project parameters. The main purpose of WAC C in the process of financial and investment analysis is its use as a discount rate when calculating NPV, DPP, IP, FCC and other indicators.
- For strategic management purposes, the indicator is used to assess the dynamics of changes in the value of an enterprise, as an indicator of the quality of management of the company's own and borrowed capital. To do this, WACC is compared to return on assets ROA. Based on the comparison results, the following conclusions can be drawn about the effectiveness of capital management:
- WACC is greater than ROA, this indicates a decrease in economic added value and a general loss of company value;
- WACC is less than ROA, this means that assets are used efficiently and the value of the organization is growing;
- Assessing the profitability of an M&A merger or acquisition transaction. To do this, the overall weighted average cost of capital after the merger is compared with the WACC of the individual assets before their merger or acquisition.
- In business valuation, as a discount rate in assessing key indicators of a business plan.
The main problems that arise in the process of practical application of the weighted average cost of capital of an organization:
- The problem of assessing the planned return on equity capital. Since there are many ways and methods for predicting the amount of equity capital, the results obtained may differ significantly from each other.
- WACC cannot be calculated for situations where the company is in loss or undergoing bankruptcy proceedings.
- The weighted average cost of capital is practically inapplicable to assessing the cost of capital of companies - startups and venture projects of various types. This is due to the fact that such projects have not yet been provided with a history of stable cash flows and the formation of periodic profits. Therefore, it is impossible to construct a reliable forecast of return on equity capital. For such cases, special expert or scoring methods are often used.
Return on assets: difference from DGC
Return on assets is calculated using the formula:
RA = F2400 / BSR1600,
where: RA - return on assets;
F2400 - value in line 2400 of the financial results report (net profit).
Thus, the fundamental difference between the RSK and RA indicators is that the numerator of the RSK formula contains a value reflecting profit before tax, and the numerator of the RA formula contains net profit.
What is the difference between these types of profits?
In fact it is minimal. Net profit is profit before tax, reduced by taxes, the amount of which is determined by the applicable taxation scheme. For example:
- with OSN it is 20% of the profit;
- under the simplified tax system - 6% of revenue or 15% of profit;
- for UTII - a fixed amount determined by a complex formula.
Thus, the RSK indicator is almost always greater than RA when analyzing the results of an enterprise’s economic activities for the same reporting period. If, for example, when considering RSK and RA at 2 enterprises of the same holding, it turns out that the RA indicator at the first is higher than RSK at the second, this may indicate a significantly more effective management scheme at the first enterprise and, as a result, become a factor for adoption owners of various organizational decisions for managing the second enterprise.
How can the value of the RSC indicator in its pure form be interpreted?
Enterprise profitability level
The current market is developing dynamically, and some trends are rapidly being replaced by others, so every company whose management is focused on stable growth must monitor the economic indicators of the organization. The data obtained as a result of such analysis will allow you to competently plan production operations, which, in turn, will lead to maximum profit growth.
In turn, the degree of efficiency of an enterprise can only be assessed by determining such a general indicator as the level of profitability. By calculating the profitability of an enterprise, it is possible to give an accurate assessment of its financial results and level of development as a whole. Profitability involves calculating the profitability of an enterprise from various positions, which allows you to display the work of all components of the company.
Return on total capital: optimal value
In some cases, this value can be assessed by comparison with the normative one - established by local regulations for a particular enterprise or formed at the industry level and accepted as normative.
When assessing the results of an enterprise’s economic activities, the dynamics of return on total capital can also be analyzed. Its growth will be welcomed by those interested in business growth. A decrease (to a level below acceptable values) may become a factor for these individuals to make decisions about adjusting approaches to business management, aimed, in particular, at stimulating profits, which forms the F2300 indicator.
The assessment of the results of economic activities based on the RSC indicator, as a rule, is supplemented by an assessment based on another important indicator - return on equity capital, which is determined by the formula:
RSoK = F2400 / B1300,
where: RSoK - return on equity;
F2400 - indicator in line 2400 of the financial results report (net profit);
B1300 - indicator in line 1300 of the balance sheet (total equity capital).
If the RSC indicator approaches the RSoK value, this may indicate that the enterprise is able to effectively generate assets without attracting external borrowed capital. This can be positively assessed by business owners.
Calculation of the SC value using the updated accounting form. balance
There are several ways to determine the amount of SC. The simplest and most understandable is the accounting calculation. balance. It is based on the summation of the values of those indicators that actually form the sum of the capital insurance (they were discussed above) minus line 1320 (shares purchased from shareholders).
We are talking about four values: UK, RK, DC and NP, which correspond to balance sheet lines 1310, 1340, 1350, 1360, 1370. The balance sheet calculation formula in this case will be as follows:
To get the amount of the capital account for the year, you should add the value of the capital account at the beginning and at the end of the required period (year). Calculation is made according to the formula:
Abbreviations in formula 2: SK - own capital for the whole year, SK n.g. – your capital at the beginning of the corresponding year, SK k.g. – your capital at the end of the same year.
In addition to the above calculation options, there is also another method used taking into account the instructions of the Ministry of Finance of the Russian Federation, presented in Order No. 84n dated 08/28/2014 (as amended on 02/21/2018). This regulatory document establishes the procedure for determining the value of net assets, which must be followed by LLCs, JSCs, state unitary enterprises, municipal unitary enterprises, industrial and housing savings cooperatives, as well as households. partnerships.
From the procedure established by the Ministry of Finance, the provisions that determine the composition of assets and liabilities taken into account in the calculation are applied in practice. So, according to the current procedure, when calculating the value of the SC, take into account:
- all assets (except for those that reflect the debts of the founders or shareholders for authorized contributions);
- all liabilities (except for income of subsequent periods, especially related to government assistance and gratuitous receipt of property).
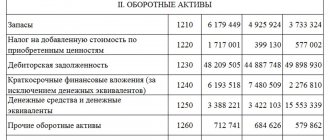
Guided by these standards, when calculating, they take data from lines 1600 (assets), 1400 (long-term liabilities) and 1500 (current liabilities). The value is calculated using the formula:
Abbreviations in formula 3: DU - the amount of debt of the founders of the household. society, DBP - the amount of income of subsequent, future periods.
When calculating the insurance company, you should also take into account the basic formula, which is quite simple and looks like this:
The balance sheet currency is the total amount for all component accounts. balance. Moreover, the total amount of assets = the total amount of liabilities.
Results
Return on total capital reflects the profitability of investments generated from all sources in the assets of the company. Calculated according to the balance sheet and financial results report of the company.
You can familiarize yourself with other formulas for calculating profitability in business in the articles:
- “Determining return on equity (formula)”;
- “How to calculate product profitability?”.
You can find more complete information on the topic in ConsultantPlus. Free trial access to the system for 2 days.
Example 2. Calculation of the SC value using the general formula
Let's assume there is data from accounting. balance sheet for non-current, current assets (VA and OA), as well as long-term and short-term liabilities (DO and KO). The sum of assets equals the sum of liabilities (A=P). You should calculate the amount of the capital account using formula 4 (Balance sheet currency – Organization liabilities).
| Conditional data for calculation | Costing itself | Counting result |
| VA: 17,000 thousand. rub.; OA: 10,500 thousand rub.; BEFORE: RUR 1050 thousand rub.; CO: 9,000 thousand rub. rub. | First calculation. A = P = VA + OA = 17,000 + 10,500 = 27,500 Second calculation. SK = A(P) – DO – KO = 27,500 – 1,050 – 9,000=17,450 | Total, the amount of SC = 17,450 thousand rubles. rub. Therefore, on page 1300 they indicate “17,450” |
Features of the indicator in our country
The calculation of the weighted average rate in our country has a certain peculiarity: WACC=SKd*(SK+2%)+ZKd*(ZK+2%)*(1-T), where:
- SKd – share of equity capital, %;
- SK - equity capital, %;
- ЗКд – share of borrowed capital, %;
- ZK - borrowed capital, %;
- T — tax rate, %.
The cost of borrowed funds is estimated as the average value of the refinancing rate in our country, which is set by the Central Bank. To calculate the average, a period of 12 months is used.
Using the indicator to evaluate investment projects
WACC is used as a discount rate to calculate the profitability of investment projects. In this case, the cost of equity capital is the profitability of alternative projects, since it is precisely this that acts as an indicator, and the value of the benefit that was lost. This kind of calculation makes it possible to accept various investment projects.
Let's look at a specific example using the WACC formula.
Basic initial data for calculations:
- profitability of project A – 50%, risk 50%;
- the profitability of project B is 20%, the risk is 10%.
Let's calculate the profitability of project B from the profitability of project A: 50% - 20% = 30%.
Let's compare profitability calculations:
- for A: 30%*(1-0.5)=15%;
- according to B: 20%*(1-0.1)=18%.
It turns out that if we want to get a return of 15%, we risk half of the capital invested in project B. On the other hand, when implementing low-risk projects, a return of 18% is guaranteed.
Above we examined options for evaluating investments using the theory of opportunity costs.
