Let's look at return on equity . In foreign sources, the return on equity ratio is designated as ROE - Return On Equity (or Return on shareholders' Equity), and shows the share of net profit in the equity capital of the enterprise.
Let's start by defining the economic essence of the return on equity ratio, then we will provide a calculation formula for both domestic and foreign forms of accounting reporting and do not forget to also talk about the standards for this indicator.
Take our proprietary course on choosing stocks on the stock market → training course
The concept of return on equity
So, in general terms, the return on equity indicator is denoted by the abbreviation ROE - Return On Equency. The coefficient clearly demonstrates what economic effect the company was able to achieve from investing its own financial resources in production.
To some, this indicator may seem identical to return on assets. This is not entirely true. The most important difference is that return on equity does not show the performance of all the assets of the enterprise, but only that part of them that is the property of the owners of the company.
Obviously, calculating the indicator makes sense only if the enterprise has its own capital. In other cases, the calculation will simply give negative values that are unsuitable for analysis.
The return on invested capital (ROIC) indicator takes into account the efficiency of using not only the organization’s own capital, but also borrowed funds.
Why is it important to calculate the profitability of an enterprise?
In most cases, it is on the basis of the financial profitability of an enterprise that an analysis of the company’s activities is carried out, which helps to draw a conclusion regarding the return on investment in a business project. Indicators correctly calculated for a number of factors and items are necessary for entrepreneurs to draw up effective business plans.
Also, these coefficients are used in the process of pricing services or goods and form the basis for a general analysis of activities at the working stage. They can be calculated either as a percentage or as a numerical indicator, with a higher number indicating greater profitability of the company.
Also, the calculation of the enterprise’s net profitability ratios is necessary in such production situations as:
- forecasting the likely profit of the enterprise that can be received in the next period;
- conducting a comparative analysis with organizations competing in the market;
- calculating the feasibility of significant investments (to determine the projected return on a future project);
- pre-sale preparation of the company (to determine its real market value).
In addition, the calculation of enterprise profitability indicators is used in such cases as lending, obtaining loans or participating in joint projects, or developing new types of products.
Calculation formulas
Return on equity is determined using the firm's net income and equity data. By substituting profit values for different time intervals (month, quarter, year), you can see how efficiently equity capital worked during this period. Like any other value, return on equity is calculated as a percentage, which facilitates analysis and allows you to compare your values with those of competitors.
ROE = Net Profit / Equity * 100%
The value of net profit can be gleaned from the income statement, and equity - from the liability side of the balance sheet.
To calculate the coefficient for a period not equal to one year, but still see comparable annual figures, the formula will have to be somewhat complicated:
ROE = Net profit * (365 / Number of days in the calculation period) / ((Equity at the beginning of the period – Equity at the end of the period) / 2) * 100%
To conduct an even more thorough analysis of the ROE value, you can use the Dupont formula, where the calculated indicator is divided into three components, which allow you to more deeply understand the reasons for a particular trend:
ROE (Dupont Formula) = (Net Profit / Revenue) * (Assets / Firm's Equity) * (Revenue / Assets) = Net Profit Margin * Financial Leverage * Asset Turnover
Financial leverage is usually understood as the ratio of an organization's borrowed funds to its own.
To calculate return on debt capital, the formula should look like this:
ROIC = Net income / ( Equity + Long-term liabilities) * 100%
Usage
After obtaining data by applying one of the formulas or several, they are analyzed. It is necessary to determine the effectiveness of work in the chosen direction and adjust further actions. The level of the coefficient affects the amount of dividends of participants and the value of the company as a whole.
The analysis determines:
- the level of competent use of financial instruments by the company, including funds raised from outside, after comparing the results on the return on personal investments and assets;
- In the process of studying the data, you should not neglect the profitability ratio of borrowed funds. The profit from the use of the loan must exceed the amount of interest paid for its use;
- a large ROE ratio, significantly exceeding the established average result, is a consequence of large financial leverage. This means that the share of borrowed funds significantly exceeds the share of own investments.
Important: the right to determine the justification of such financial risks belongs to the owners of the company.
To really assess the situation at an enterprise, it is necessary to systematically calculate coefficients to compare them over several periods.
Based on the calculations carried out, conclusions can be drawn regarding:
- Increasing the volume of personal funds
- Growth in the total amount of debt obligations
- Reducing the level of asset turnover
- Company profit growth
- Increased financial risks.
After receiving data and an objective assessment of the situation, further actions can be taken to improve the financial microclimate.
Balance calculation
Like all other types of indicators, return on equity and invested capital ratios can be calculated using formulas from the balance sheet. In this case, the calculation formulas will look like this:
ROE = Line Value 2400 / Line Value 1300 * 100%,
ROIC = Row Value 2400 / Total Row Value 1300 and 1400 * 100%
Average statistical values by year for Russian enterprises
| Revenue amount | Values by year, rel. units | ||||||
| 2012 | 2013 | 2014 | 2015 | 2016 | 2017 | 2018 | |
| Micro-enterprises (revenue < 10 million rubles) | -0.080 | 0.000 | -0.090 | -0.130 | 0.015 | -0.257 | -0.190 |
| Mini-enterprises (10 million rubles ≤ revenue < 120 million rubles) | -0.015 | 0.031 | -0.049 | 0.028 | 0.082 | -0.005 | 0.017 |
| Small enterprises (RUB 120 million ≤ revenue <RUB 800 million) | 0.049 | 0.077 | -0.013 | 0.043 | 0.098 | 0.037 | 0.063 |
| Medium-sized enterprises (RUB 800 million ≤ revenue <RUB 2 billion) | 0.091 | 0.068 | 0.003 | 0.060 | 0.119 | 0.081 | 0.030 |
| Large enterprises (revenue ≥ 2 billion rubles) | 0.123 | 0.091 | 0.079 | 0.110 | 0.130 | 0.095 | 0.130 |
| All organizations | 0.107 | 0.081 | 0.052 | 0.089 | 0.121 | 0.077 | 0.107 |
Table values are calculated based on Rosstat data
How to analyze indicators correctly
Analyzing return on equity values can be a major help in assessing potential income when investing in a particular business. The level of dividends and the investment attractiveness of the company as a whole largely depend on the value of the coefficient.
- If you compare the indicators of return on equity and assets, you can assess how competently the enterprise uses financial leverage, i.e. loans and credits. If the share of such borrowed funds in the volume of assets increases, the return on equity capital will also increase proportionally.
- Even if the ROE ratio shows steady growth, it is worth assessing the effectiveness of raising borrowed funds. If the effect of using the attracted capital prevails over the interest for their operation, the decision to attract borrowed capital is justified.
Undoubtedly, the higher the indicator value, the better. However, there may be pitfalls here too. Having carefully studied the DuPont formula, you can understand that a high value of the ratio may be a consequence of high financial leverage, when the share of borrowed capital significantly exceeds the share of the enterprise's own funds. In this case, a high ROE value is achieved at the expense of significant financial risks. How justified such a strategy is, each businessman must decide for himself.
So, if ROE or ROIC is declining compared to the previous period or competitors, this could mean:
- The amount of equity capital increases (for ROE).
- The total amount of debt obligations (for ROIC) is growing.
- The asset turnover rate is decreasing.
And on the contrary, if there is an increase in the indicators under consideration, this gives reason to talk about the following trends:
- Financial leverage increases.
- The organization's profits are growing.
Is high ROE always good?
As previously discussed, in an ideal situation, the rule “the higher the ROE, the better” is obvious. However, the realities of life are always far from ideals. There are often cases when high returns on equity should alert an investor and become a reason for a more detailed study of the company's financial statements and activities.
The ROE formula involves using information about the company's equity in the calculations. At the same time, the use of credit can increase the profitability indicator - the second component of the coefficient.
An enterprise's debt burden is considered acceptable at the level of 50-70%. A credit load exceeding this threshold creates preconditions for the company's bankruptcy. It is also important to understand the nature of the credit load, since long-term loans are always preferable to short-term ones.
The second exception to the rule “the higher the ROE, the better” can be considered the average industry indicators of KRSK. It is impossible to choose an industry for investment by comparing the value of the coefficient under consideration. Each type of elevation has its own characteristics. Capital-intensive production will always have a lower ROE than, for example, the IT industry. Heavy industry has a significant number of assets and a high level of leverage. High-tech firms, on the contrary, with relatively small equity capital, can generate a high flow of profit.
Therefore, a high ROE should not be the main guideline when choosing an investment industry.
Example of coefficient calculation
Let's consider the procedure for calculating the ROE and ROIC coefficients for a conditional Russian enterprise. To assess efficiency and track dynamics, consider the company’s financial statements for the 4th quarter of 2021.
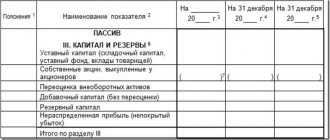
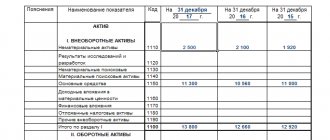
So, the values of line 1300 (total for the “Capital and Reserves” section) are:
1st quarter of 2021 - 102,345,294 rubles, 2nd quarter of 2021 - 115,035,682 rubles, 3rd quarter of 2021 - 121,729,554 rubles, 4th quarter of 2021 - 123,305,612 rubles.
The values of line 1400 (total for the “Long-term liabilities” section) are:
1st quarter of 2021 - 81,845,543 rubles, 2nd quarter of 2021 - 82,342,572 rubles, 3rd quarter of 2021 - 87,431,234 rubles, 4th quarter of 2016 - 65,309,517 rubles.
In line 2400 (Net profit / loss) we see the following indicators:
1st quarter of 2021 – -3,134,561 rubles, 2nd quarter of 2021 – 3,701,495 rubles, 3rd quarter of 2021 – 567,892 rubles, 4th quarter of 2016 – 8,823,515 rubles.
Using balance sheet calculation formulas, we determine the values of return on equity and employed capital:
ROE indicators:
ROE 2016-1 = -3,134,561 / 102,345,294 * 100% = -3.06% ROE 2016-2 = 3,701,495 / 115,035,682 * 100% = 3.22% ROE 2016-3 = 567,892 / 121,729,554 * 100% = 0.47% ROE 2016-4 = 8,823,515 / 123,305,612 * 100% = 7.15%
ROIC indicators:
ROIC 2016-1 = -3,134,561 / (102,345,294 + 81,845,543) * 100% = -1.70% ROIC 2016-2 = 3,701,495 / (115,035,682 + 82,342,572) * 100% = 1.88% ROIC 2016-3 = 567,892 / (121,729,554 + 87,431,234) * 100% = 0.27% ROIC 2016-4 = 8,823,515 / (123,305,612 + 65,309,517) * 100% = 4.68%
From the calculations made, a competent analyst will be able to glean a lot of valuable information, as well as draw a number of important conclusions:
- First of all, the negative ROE value in the first quarter is striking, which was a consequence of the lack of profit. However, further developments show that this situation turned out to be the exception rather than the rule and should not be considered as an obstacle to investment.
- Tracing the dynamics of changes in profitability parameters, one can see that the parameters take the highest values in the second and fourth quarters. Perhaps the company's main activities are seasonal. In this case, a potential investor should think about investing their funds during those periods when the potential income may be greatest. Company owners, on the contrary, should think about finding alternative sources of income during periods with the lowest (and even more so negative) profitability.
- The obtained profitability values seem to be relatively low, which suggests a rather low production efficiency. However, for the most honest comparison with its closest competitors, it is necessary to know exactly the direction of the company’s activities.
- The company is difficult to consider as an object for serious investment, since ROE and ROIC indicators for each period are less important than the average percentage for risk-free investments (for example, deposits in commercial banks).
For real enterprises, the calculation is made in a similar way. All the necessary information, as a rule, can be found on the official websites of organizations.
Normal value
As previously mentioned, an enterprise with an ROE indicator exceeding 2 times the rate on bank deposits is a desirable goal for any investor. Warren Buffett also pays special attention to this multiplier when investing. In his opinion, a company with a high KRSK level and a small credit load has excellent investment prospects.
We present the average ROE values typical for various sectors of Russian industry.
Based on them, an investor can form an approximate idea of acceptable coefficient values in a particular area of business. Examples of “KRSK” of certain sectors of the Russian economy
| Sectors of the Russian economy | 2016 | 2017 | 2018 |
| All industries of the Russian Federation | 35,5% | 33,3% | 30,5% |
| Crop and livestock farming, hunting and provision of related services in these areas | 13,8% | 9,7% | 9,2% |
| Coal mining | 23% | 33% | 33% |
| Crude oil and natural gas production | 15% | 18,2% | 25% |
| Food production | 25,2% | 24,7% | 22,9% |
| Production of tobacco products | 42,8% | 69,2% | 67% |
| Production of medicines and materials used for medical purposes | 22,3% | 18,4% | 14,7% |
| Wood processing and production of wood and cork products, except furniture, production of straw products and wicker materials | 34,1% | 32,4% | 33,5% |
| Metallurgical production | 26,5% | 30,7% | 27,7% |
| Postal and courier activities | 41,6% | 44,1% | 46,8% |
| Publishing activities | 18,7% | 17,8% | 14,6% |
| Computer software development, consulting services in the field and other related services | 44,5% | 42,6% | 39,7% |
Comparison of indicators
To better understand the differences between the return on equity and attracted capital, their economic essence can be presented in the form of a small summary table:
| ROE | ROIC | |
| The main differences of the indicator | The company invests exclusively its own capital in production | Both own capital and attracted (borrowed) funds can be used for investment. |
| Optimal period for assessment | One year | One year |
| What industry is it used in? | At any | At any |
| What trend is favorable for the enterprise? | Indicator growth | Indicator growth |
| To whom it may be of interest | Owners of the enterprise | Owners and investors |
| Accuracy of the company's financial performance assessment | Less | More |
Key factors influencing enterprise profitability
In order to make correct calculations and correctly predict indicators in the further activities of the organization, it is important to know and understand the factors that, to varying degrees, influence the net profitability of the enterprise. They are divided into two groups – exogenous and endogenous.
Exogenous factors include:
- state tax policy;
- general sales market conditions;
- geographical location of the company;
- level of competition in the market;
- features of the political situation in the country.
Quite often, the net profitability of an enterprise, as well as its profit indicators, is affected by factors such as its geographical location, proximity to sources of raw materials or consumers. The situation on the stock market and currency exchange rate fluctuations are also significant.
Endogenous, or internal production factors that influence the net profitability of an enterprise are presented:
- good working conditions for personnel at any level (which has a positive impact on product quality);
- the efficiency of logistics and marketing policy of the enterprise;
- general financial and management policies of the company's management.
By taking into account such nuances, an experienced economist calculates the level of net profitability of an enterprise with maximum accuracy and realism.
What values should you focus on?
When discussing certain reference values, it is worth clearly understanding that the average coefficients will largely depend on macroeconomic indicators and the general economic situation in the country. Thus, for countries with developed market economies, the average standard values of return on equity are approximately 10-12%. These are the numbers that people usually rely on, for example, in the UK or the USA.
In countries with less stable economies and serious inflation (unfortunately, Russia can be included among them), the average value should be higher. The main comparative criterion here can be the so-called percentage of alternative yield. It shows what income the owner of the capital could expect by investing his money in another business.
For example, an ordinary bank deposit can guarantee an income of 9% per annum. The business in which the entrepreneur invested brings in only 6% of net profit per year. Of course, a reasonable question arises about the advisability of further running such a business.
So, we examined in detail the profitability indicators ROE and ROIC - we found out what they are and how to correctly calculate their values. If the reader still has any questions, we suggest watching the video:
We have collected everything on the topic “Profitability” in one place: • Sales profitability; • Return on assets; • Product profitability; • Return on investment; • Profitability of production.
What is factor analysis of profitability
Factor analysis of profitability is an integral part of financial analysis and, in turn, can be divided into a number of models, the most used of which are additive, multiplicative and multiple.
The construction of such models allows you to create mathematical dependencies among all the studied indicators.
Additive models are used when, in order to obtain an indicator, the values of a particular factor need to be added or subtracted, multiplicative models - when it is necessary to multiply them, and multiples - in the case of dividing certain indicators by each other.
When using different models, they speak of combined or mixed types. To conduct a full factor analysis of the net profitability of an enterprise, multifactor models using various profitability indicators are used.
Using factor analysis, the exact amount of income that is obtained as a result of the influence of internal factors can be calculated. To determine it, the simplest formulas are used:
Profitability = (Profit from sales of products / Cost of production) × 100%
or
Profitability = ((Product price – Product cost) / Product cost)) × 100%.
In most cases, such financial analysis requires the use of a three-factor or five-factor model. In this case, the number of factors used in the calculation process affects the name of the model:
- with a three-factor model, indicators of profitability of manufactured products, capital intensity, and turnover of fixed assets are used;
- The five-factor model involves the use of labor and material intensity, depreciation, and turnover of all types of capital.
The basis of factor calculation is the division of all formulas and indicators into quantitative and qualitative, thanks to which the company’s activities can be assessed from various angles. The analysis reveals the connection between profit and capital productivity with the net profitability of the enterprise (the higher the first two factors, the higher the profitability). That is, with its help you can see the relationship between standards and the results of economic activity.
Ways to increase enterprise profitability
For any entrepreneur, increasing the profitability of his own enterprise is essential. As mentioned above, profitability indicators depend on external and internal factors. The first group consists of the international situation, domestic government policy, natural conditions and resources, geographical location, level of economic development, and international price level. These factors must be taken into account, but it is impossible to significantly influence them.
And the situation is completely different with internal factors, which are represented by circumstances and processes occurring within the enterprise itself and controlled directly by the manager. Let us conclude how to increase the level of net profitability of an enterprise. This is possible by taking the following measures:
- improving the quality of products;
- formation of additional consumer properties and qualities of these products;
- increasing production volumes;
- optimization of the number of working personnel and attracted resources;
- work on the issue of resource and energy saving;
- optimization (rational use) of available resources for production;
- timely implementation of technical re-equipment of the material base of production;
- advanced training of working personnel;
- selling or leasing excess resources and production capacity;
- searching for new types of raw materials;
- finding new and expanding existing markets for products.