Each organization has assets and liabilities, which, in turn, are divided into long-term and current. If the former influence the development prospects of the company as a whole, then the latter influence the situation in the reporting period. Let's look at them in more detail.
The organization's resources that are directly involved in turnover and are capable of generating income for the company over a short period of time are called current assets. Since such resources are very mobile (as can be seen even from their name), they need to be given special attention in accounting. Moreover, current assets are a separate group in the company’s balance sheet, and the balance must be correctly indicated for all accounts that are included in it. Based on these data, the liquidity ratio is usually determined.
Formula for the average annual value of assets on the balance sheet
To calculate the average amount of assets of an enterprise for a year, it is necessary to add up the amount of assets at the beginning and end of the year. This amount is then divided by 2 or multiplied by 0.5.
The formula for the average annual value of assets on the balance sheet uses financial reporting data.
In general, the formula for the average annual value of assets on the balance sheet is as follows:
SA avg = (SAnp + SAkp) / 2
Here CA av is the average annual value of assets,
SAnp – asset value at the beginning of the period,
SACP is the value of assets at the end of the period (year).
The formula for the average annual value of assets on the balance sheet allows you to make calculations both for the assets of the enterprise as a whole, and separately for current and non-current assets.
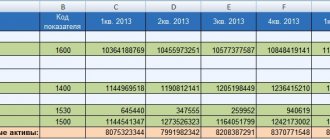
The total assets of the enterprise are recorded on line 1600 of the balance sheet, which is compiled by accountants at the end of each year. When applying this formula, they use balance sheet indicators for several years, while the indicator on line 1600 is taken from the balance sheet for each year, summed up and subsequently divided by 2.
In the case of calculations for current assets, the formula for the average annual value of assets on the balance sheet will require information from line 1200 of the balance sheet. If calculations for non-current assets are required, then the accountant uses the indicators on line 1100 of the balance sheet. The indicators must be used in a similar way by finding the average value of assets and comparing balance sheet data for the corresponding years.
How to reflect in accounting and reporting
The coefficient allows you to determine the number of transfers of mobile assets into cash and vice versa.
The development of an enterprise is impossible without a detailed analysis of the results of its activities, including an assessment of the dynamics, composition and structure of the organization’s resources used. One of the most important elements of this process is the study of asset turnover ratios.
The indicators must be used in a similar way by finding the average value of assets and comparing balance sheet data for the corresponding years.
The total assets of the organization consist of:
- working capital - they are consumed in one production cycle or written off from the balance sheet during the year;
- non-current - part of the resources with a service life (consumption) of more than a year.
The ratio is the ratio between revenue and average annual assets. The value of the indicator indicates how many goods and services were sold during the period under study for each ruble of assets used.
Take revenue from the income statement for the analyzed period. Dividing it by the average value of current assets, multiply the resulting figure by the number of days in the reporting period.
For example, if during the year the current asset turnover ratio increased from 1.4 to 2, this is a positive trend. However, it is difficult to say whether a value equal to 2 is an optimal, acceptable or critical turnover indicator for an enterprise. At2 - current assets of the enterprise at the end of the period. You can then analyze the effectiveness of their use.
The value of the average annual value of assets on the balance sheet
The average annual value of assets, which is calculated by analysts, is subsequently used when calculating coefficients that can characterize the state and efficiency of any enterprise:
- Return on assets
- Asset turnover ratio, etc.
The indicator is also used to find the reasons that led to changes in the operation of the enterprise and make decisions in the field of resource management.
The average annual value of assets indicator can give a more accurate understanding of the size and value of assets, while it neutralizes circumstances that can distort the real amount of assets.
If the asset turnover indicators of different enterprises for different years are compared, then it is necessary to check the uniformity of the assessment of the average annual amount of assets.
When calculating some financial analysis indicators, the average annual value of assets is required. Why can't you just use balance sheet data at the end of the period? You will find the answer in the article. In addition, you will learn how this value is calculated, where it is applied and what of the company’s assets is never involved in its calculation.
Net assets
Net assets (English Net Assets) – reflect the real value of the enterprise’s property. Net assets are calculated by joint stock companies, limited liability companies, state-owned enterprises and supervisory authorities. The change in net assets allows you to assess the financial condition of the enterprise, solvency and level of bankruptcy risk. The methodology for assessing net assets is regulated by legislation and serves as a tool for diagnosing the risk of bankruptcy of companies.
Average annual value of assets on the balance sheet: how to calculate
This is one of the simplest indicators in financial analysis. To calculate it, you do not need to remember a complex formula. It all comes down to the rules of mathematics about calculating averages.
If you know the values of two numbers, how do you find their arithmetic mean? The answer is obvious - add and divide by two. Now let's translate this simple rule into the language of balance sheet lines, and we will get four formulas at once: both in general for the entire value of assets, and for individual components.
| For which indicator is the average value calculated? | Formula indicating lines in the balance sheet (BB) | What does the resulting value show? |
| 1 For assets | (1600 BB at the beginning of the year + 1600 BB at the end of the year) ÷ 2 | The average balance sheet valuation of the enterprise’s property, which is under its ownership |
| 1600 BB – BB currency | ||
| 2 For non-current assets | (1100 BB at the beginning of the year + 1100 BB at the end of the year) ÷ 2 | Average balance sheet valuation of property whose circulation period exceeds 12 months |
| 1100 – the result of Section I of the BB | ||
| 3 For current assets | (1200 BB at the beginning of the year + 1200 BB at the end of the year) ÷ 2 | The average balance sheet value of property that has been in circulation for less than one year or the normal operating cycle of the enterprise |
| 1200 – the result of Section II of the BB | ||
| 4 For net assets | [(1600 BB at the beginning of the year – 1400 BB at the beginning of the year – 1500 BB at the beginning of the year + 1530 BB at the beginning of the year) – (1600 BB at the end of the year – 1400 BB at the end of the year – 1500 BB at the end of the year + 1530 BB at the end year)] ÷ 2 | The average balance sheet valuation of the enterprise’s property, which was acquired exclusively from its own capital. Otherwise – “cleared” of the company’s obligations |
| 1400 – the result of Section IV of the BB, 1500 – the result of Section V of the BB, 1530 – deferred income |
All formulas use the values of indicators at the beginning of the year. Where can I get them if the balance sheet of an ordinary commercial organization contains data exclusively as of December 31? You can use a simple rule from accounting: the ending balance of one day is equal to the beginning balance of the next day
.
- as of December 31, 2021 – we equate it to January 1, 2021. And this is the cost at the beginning of the analyzed year;
- as of December 31, 2021 – value at the end of the analyzed year.
Pay attention to the order of the columns in the balance sheet. Starting with the financial statements for 2011, it is as follows:
- the first column with numbers corresponds to the earliest date;
- middle column – the date that precedes the reporting date;
- the far right column is the latest date of all presented.
Thus, from one balance sheet it is possible to calculate the average annual indicators for two years at once.
There is one very revealing technique. It is based on the calculation of the average annual value of assets. The output is a conclusion about the type of development of your organization (extensive or intensive). Download the Excel file and simply plug in the numbers from your company’s reporting.
How to calculate the average annual cost of non-current and working capital
Accounting
Since all, in fact, the company’s property has a heterogeneous composition, it is taken into account in different accounts of the chart of accounts, approved by order of the Ministry of Finance of the Russian Federation dated October 31, 2000 No. 94n (as amended on November 8, 2010). In particular, the following accounts are used for this:
- 50 "Cashier";
- 51 “Current account” (and 52 “Currency account”);
- 58 “Financial investments”;
- 10 "Materials";
- 41 "Products";
- 62 “Settlements with buyers and customers”;
- and others similar, which are located in the sections “Inventory”, “Cash”, “Finished products and goods”, “Calculations”.
Liabilities also relate to negotiable assets, since in essence they are already invested money that belongs to the company. All these accounts are grouped into several lines on the balance sheet, and a special formula is used to determine what to enter in each of them.
Why is the average annual value of assets calculated?
Here are two answers to this question.
First answer.
The balance sheet shows a picture of the life of the enterprise
at the moment
, that is,
for a specific day
and even for a specific hour. When you look at an asset, you see what property the company has at the reporting date. The situation will definitely change tomorrow:
- new debts of counterparties will appear, and some of the old debts will be repaid;
- new goods will be purchased, and those that were in the warehouse will be written off due to sale, damage or shortage;
- the day of salary payment will come, and a cash outflow will be formed based on this, etc.
If an analyst decides to smooth out all such jumps and understand what the average valuation of property is for a certain period, then the indicator of the average annual value of assets will come to his aid.
It turns out that the first reason for the calculation is to level out fluctuations in the value of property, and on this basis make a correct comparison across different years.
Second answer.
Let's compare what the table headers look like for the balance sheet and the income statement.
The difference is obvious. All indicators of income, expenses and financial results, in contrast to balance sheet values, are calculated cumulatively for a certain period
.
Proceeds are not available as of December 31, 2021. It is formed over the year as a whole
. Or, let’s say, for a month, a quarter, a half year.
What does this understanding provide? The ability to understand, and therefore not forget, the rule: if data from the balance sheet and the financial results report are used simultaneously in one calculation formula, then the former are taken in an average annual value
. If this is not done, then it turns out that the analyst is trying to link together the momentary (point) assessment with the assessment for the period. It is not correct.
Where does the average annual value of assets come into play in financial analysis? For example, in profitability and turnover formulas, and also in factor models. For convenience, we have collected some of these indicators and factor analysis formulas in a table. All of them relate, first of all, to the average annual value of assets as a whole. However, turnover and profitability are calculated in the same way for non-current, current and net assets.
Table 2 – Where the average annual value of assets comes in handy
| Indicator/ratio | |
| Revenue ÷ Average annual asset value | |
| Net profit ÷ Average annual asset value | |
| 3 Two- and three-factor DuPont models | Return on assets = Return on sales × Asset turnover |
| Return on Equity = Return on Sales × Asset Turnover × Equity Multiplier | |
| 4 “Golden” rule of enterprise economics | 100% net profit |
Average annual asset value: all formulas
Other approaches to calculating the average value of assets per line on the balance sheet
The above formulas for calculating the average annual value of assets by line on the balance sheet are the most common option. But what if you need to calculate a figure for a period that is longer than one year? Or, for example, don’t you like the fact that to calculate the annual average, only data for the beginning and end of the year is taken and the intermediate values between these dates are not affected at all? After all, this directly affects the accuracy of the final indicator.
Obviously, judging the average value of assets for the year by only two values is like trying to get through to someone and only knowing two digits of their phone number.
In such cases, the average chronological formula for a moment series will help:
X – the average annual value of any indicator, including assets in general, as well as non-current, current and net assets;
n – number of reporting dates for which calculations are made.
For example, you decided to use one balance sheet to calculate the average annual value of assets (A) for two years at once - 2017 and 2018. Then the formula is interpreted as follows:
And if your organization generates a balance sheet monthly (in theory, this is how it should be), and you decide to calculate the average value of assets based on all twelve months of the reporting year, then use the formula:
What information is not included in the balance sheet asset
In reality, the average annual value of a firm's assets according to accounting data is likely greater than what is shown on the balance sheet. How is this possible if the balance is compiled according to the ledger accounts? The reason is the so-called regulatory accounts, which reduce the amounts on the balance sheet lines. We will not go into the intricacies of accounting, but simply name what exactly does not fall into the balance sheet, and therefore does not form the average annual value of assets. This will be part of the cost:
- Fixed assets and intangible assets, which corresponds to the depreciation accrued on them;
- Materials, goods, finished products, for which a reserve has been created to reduce the cost of material assets. Such a reserve is created when inventories have hopelessly lost their original characteristics, become obsolete, or become much cheaper than the cost of acquisition;
- Goods in retail trade organizations, when they are accounted for at sales prices. We are talking about that part of the cost that is formed by the trade margin. The markup is the income that has not yet been earned by the enterprise from the future sale of these goods. It is precisely because of its “unearnedness” that it is excluded from the asset;
- Accounts receivable in the amount of the provision for doubtful debts. If the receivables include debts for which the repayment period has expired, there is no collateral and there is a high probability of non-repayment, then a reserve is created. Its value is excluded from the balance sheet, and, therefore, from the average annual value of assets. This is done so that users of the enterprise’s financial statements see the assessment of funds in the calculations as close to reality as possible. That is, the amount that the organization actually expects to be received in the near future and in which there are no bad debts.
How to find the average annual value of assets - an example
Calculating the average annual value of assets is usually not difficult. At the same time, it underlies a rather interesting and at the same time simple methodology for determining the type of development of an enterprise. Let's see how it is implemented in practice. To do this you need to calculate:
- average annual value of assets;
- average annual net asset value;
- their turnover and profitability.
Calculations are based on data from the balance sheet and income statement of PJSC Saratov Oil Refinery (Refinery) for 2018.
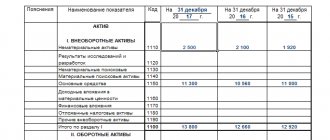
Table 3 – Excerpt from the balance sheet, million rubles
Table 4 – Excerpt from the report on financial results (OFR), million rubles.
Table 5 – Estimated indicators
| Index | Growth rate, units | ||
| 5.1 Average annual value of assets, million rubles. (arithmetic average of line 3.1 by year) | |||
| 5.2 Average annual value of net assets, million rubles. (arithmetic average of the values for years, which are obtained as [line 3.1 – line 3.2 – line 3.3 + line 3.4]) | |||
| 5.3 Asset turnover, turnover (line 4.1 ÷ line 5.1) | |||
| 5.4 Net asset turnover, turnover (line 4.1 ÷ line 5.2) | |||
| 5.5 Return on assets, rub./r. (line 4.2 ÷ line 5.1) | |||
| 5.6 Return on net assets, rub./r. (line 4.2 ÷ line 5.2) | |||
| 5.7 Geometric mean for changes in turnover, units. (square root of the product of lines 5.3 and 5.4 by column 4) | |||
| √(1,029 × 1,010) | |||
| 5.8 Geometric mean for changes in profitability, units. (square root of the product of lines 5.5 and 5.6 by column 4) | |||
| √(1,299 × 1,275) | |||
| 5.9 Extensity coefficient, % ([line 5.7 – 1] ÷ [line 5.8 – 1] × 100) | |||
| 5.10 Intensity factor, % (100 – line 5.9) | |||
Conclusions:
- an increase in the average annual value of assets is always a good sign, which indicates that the enterprise is not “eating away” its capital, but, on the contrary, is increasing it;
- comparison of the growth rate of the average annual value of assets (110.8%) with the growth rate of revenue (114.0%) gives another signal about the development of the enterprise. This is so because every ruble invested in assets provides the organization with an increase in income in the amount of more than one ruble;
- the increase in the average annual value of net assets of PJSC Saratov Oil Refinery (12.9%) exceeds the increase in property (10.8%). This means that the share of the organization’s liabilities is reduced, and the share of equity capital is growing, because net assets are formed exclusively from its own sources. All this is an indicator of strengthening financial stability;
- the average growth rate for asset turnover and net assets is 101.9%, and for profitability - 128.7%. That is, the increase in profit per ruble of property exceeds the increase in income by the same amount. This situation is very desirable for any company. It means that costs are either decreasing or growing slower than income, as is the case with the Saratov Refinery;
- the ratio of factors of extensive and intensive development in the enterprise’s activities is 6.7% to 93.3%. And this is also a very positive point. It turns out that although new resources are involved in the turnover of the enterprise, business growth is determined mainly not by this, but by improving the quality of their use.
Important: when, as a result of calculations, you get a negative value for the extensiveness coefficient. This happens when profitability decreases against the background of increasing turnover. How to interpret this situation? How extremely negative. In this case, do not be confused by the significant value of the intensity coefficient, which will also exceed 100%. Remember that this technique is inherent in such distortion. The general rule for its use is this: both coefficients should ideally be positive, and the intensity value should be at least 50%.
When studying the performance of an organization and analyzing its performance, indicators are used both for a specific date and for a certain period of time. These indicators can be used to calculate various kinds of coefficients. For example, it is determined by dividing profit for the period by the value of assets. However, it would not be entirely correct to attribute profit, for example, for the year to the value of assets at the end of the year, because then the dynamics of assets during the year are not taken into account. To “soften” fluctuations in the value of assets on a specific date, their average value is calculated. And in the return on assets formula, profit is divided not by the value of assets on a specific date, but by the average value of assets. Similarly, it is determined by dividing revenue for the period by the average amount of assets for the same period. We will tell you how to find the average amount of assets on the balance sheet in our material.
Analysis of net asset growth rate and international credit rating
In the scientific work of Zhdanov I.Yu. shows that there is a close connection between the rate of change in the net assets of an enterprise and the value of the international credit rating of such agencies as Moody's, S&P and Fitch. A decrease in the economic growth rate of net assets leads to a decrease in the credit rating. This in turn leads to a decrease in the investment attractiveness of enterprises for strategic investors.
Summary
Net asset value is an important indicator of the amount of real property of an enterprise. Analysis of the dynamics of changes in this indicator allows us to assess the financial condition and solvency. The value of net assets is used in regulated documents and legislation to diagnose the risk of bankruptcy of companies. A decrease in the growth rate of an enterprise's net assets leads to a decrease not only in financial stability, but also in the level of investment attractiveness. Subscribe to the newsletter on express methods of financial analysis of an enterprise.
Author: Ph.D. Zhdanov Ivan Yurievich
Average assets are...
There may be different options for determining the average value of assets. The simplest version of the average value of assets is the arithmetic average of their value at the beginning and end of the year.
However, the average value can be determined differently.
Let us recall, for example, how the average value of property, recognized as an object of taxation for property tax, is calculated at the end of the year (clause 4 of Article 376 of the Tax Code of the Russian Federation):
AND SG = (OS 01.01 + OS 01.02 + OS 01.03 + … + OS 01.12 + OS 31.12) / 13,
where OS 01.01, OS 01.02, OS 01.03, ...OS 01.12, OS 31.12 - the residual value of the property as of 01.01, 01.02, 01.03, ...01.12, 31.12 of the current year, respectively.
Thus, to determine average assets, the formula will depend on how high the frequency of certain averaged data is: indicators can be either daily or quarterly, etc.
However, for the purposes of balance sheet analysis, the average annual value of assets is defined as the average of their values at the beginning and end of the year.
An example of calculating asset turnover:
Describing in more detail the process of asset turnover Money - Goods - Money, you can get the picture presented in Figure 9.
Linking current assets to sales increases the value of their market value (usually their net realizable value). Thus, although the market price of fixed assets is usually neglected in historical cost accounting, it is not ignored for current assets. First, the notes to the balance sheet can show the market value of some current assets. If the indicator is not high enough, then it is necessary to work towards optimizing the amount of assets. To do this, you can sell part of the unloaded non-current assets (if an increase in workload is not planned), reduce the amount of inventories (if their volume is excessive), take measures to return accounts receivable, etc.
Average assets on balance sheet
The average annual value of assets in the balance sheet (A SG) is determined by the formula (Order of the Ministry of Finance dated July 2, 2010 No. 66n):
A SG = (line 1600 NG + line 1600 KG) / 2,
where line 1600 NG is the amount on line 1600 as of December 31 of the previous year;
line 1600 KG - the amount on line 1600 as of December 31 of the reporting year.
At the same time, the average value of individual groups or types of assets can be separately calculated from the balance sheet. For example, the average value of non-current assets or the average value of inventories, etc.
Exercise
Based on financial statements 1, 2, 5, calculate:
1) indicators of the efficiency of use of production resources (fixed assets, working capital, material resources);
2) indicators of turnover of working capital;
3) indicators of profitability of activities;
4) solvency indicators;
5) indicators of financial stability;
6) indicators of net assets and net working capital.
Arrange in tables and write a conclusion about the financial condition in the analyzed period.
1)
ANALYSIS OF THE EFFICIENCY OF USE OF PRODUCTION RESOURCES
| Indicator name | Previous Year (2003) | Reporting year (2004) |
| Profit (loss) before tax | ||
| Average annual cost of fixed assets | ||
| Capital productivity | ||
| Capital intensity | ||
| Average annual cost of working capital | ||
| Average annual cost of material resources | ||
| Material efficiency | ||
| Material consumption | ||
| Profit (loss) from sales | ||
| Profit per 1 rub. mat. costs |
Average annual cost of fixed assets
= sum of indicators p. 190 for the reporting year /2
a) for 2003: (162840+68718)/2 = 115779
b) for 2004: (68718+66030)/2 = 67374
Capital productivity
= Revenue (net) from the sale of goods / Average annual cost of fixed assets
a) for 2003: 197832/115779 = 1.71
b) for 2004: 181494/67374 = 2.69
Capital intensity
= Average annual cost of fixed assets / Revenue (net) from the sale of goods
a) for 2003: 115779/197832 = 0.59
b) for 2004: 67374/181494 = 0.37
Average annual cost of working capital
= sum of indicators p. 290 for the reporting year /2
a) for 2003: (28610+38160)/2 = 33385
b) for 2004: (38160+54648)/2 = 46404
Average annual cost of material resources
= inventory + VAT on purchases. values/ 2
a) for 2003: ((20200+ 1526)+(20552+1880))/2 = 22079
b) for 2004: ((20552+1880)+(34480+2080))/2 = 29496
Material efficiency
= Revenue (net) from the sale of goods / Average annual cost of material resources;
a) for 2003: 197832/ 22079 = 8.96
b) for 2004: 181494/ 29496 = 6.15
Material consumption
= Average annual cost of material resources / Revenue (net) from the sale of goods.
a) for 2003: 22079/197832 = 0.11
b) for 2004: 29496/181494 = 0.16
Profit per 1 rub. material costs
= Revenue (net) from the sale of goods / Profit (loss) from sales
a) for 2003: 197832/ 12860 = 15.38
b) for 2004: 181494/ 13944 = 13.02
The efficiency of using materials has decreased, as can be seen from the table:
Material intensity increased by 0.05, it shows how many material resources are needed to produce units. products.
Material productivity for the reporting period decreased by 2.81, this indicator characterizes the number of products produced per 1 ruble. consumed material resources.
Capital productivity shows how many products are produced using 1 ruble. fixed assets. During the analyzed period, there was an increase in indicators.
The value of the capital intensity indicator decreased. Capital intensity characterizes the amount of fixed assets necessary to produce products worth 1 ruble.
2)
ANALYSIS OF WORKING CAPITAL TURNOVER INDICATORS
Average annual cost of total capital
= balance amount at the beginning and end of the period
a) for 2003: (191450+106878)/2=149164
b) for 2004: (106878+120678)/2=113778
Average annual cost of working capital
= amount line 290 at the beginning and end of the period
a) for 2003: (28610+38160)/2=33385
b) for 2004: (38160+54648)/2=46404
Capital turnover ratio
=revenue /avg. cost of capital;
a) for 2003: 197832/149164=1.33
b) for 2004: 181494/113778=1.60
The working capital ratio is calculated in a similar way.
Turnover in days
= (average cost of working capital / sales revenue) X360;
The total capital turnover ratio increased by 0.27;
The duration of turnover of total capital decreased by 45.76;
The duration of working capital turnover increased by 31.29
The indicators of the enterprise's capital turnover give grounds to conclude that its use is deteriorating, however, the indicators of working capital turnover are growing.
3) PROFITABILITY INDICATORS
| Indicator name | Previous Year (2003) | Reporting year (2004) | Deviation |
| Revenue (net) from the sale of goods | |||
| Profit (loss) from sales | |||
| Return on sales in % | |||
| Average annual cost of capital | |||
| Return on equity in % | |||
| Average annual cost of working capital | |||
| Return on working capital in % | |||
| Average annual cost of fixed assets | |||
| Return on fixed assets in % |
Return on sales
= Profit (loss) from sales / Revenue (net) from sales of goods
a) for 2003: 12860/197832=0.065
b) for 2004: 13944/181494=0.077
Return on Equity
= Profit (loss) before tax / Average annual cost of capital
a) for 2003: 11426/149164=0.077
b) for 2004: 9170/113778=0.08
Return on working capital
= Profit (loss) before tax / Average annual cost of working capital
a) for 2003: 11426/33385=0.342
b) for 2004: 9170/46404=0.198
Return on fixed assets
= Profit (loss) before tax / Average annual cost of fixed assets
a) for 2003: 11426/115779=0.098
b) for 2004: 9170/67374=0.136
The return on sales indicator, which characterizes how much profit a company has from 1 ruble. sales grew by 1.2% in the reporting period. Return on equity increased by 0.3% compared to the previous period. Return on equity, which characterizes the return on equity, decreased by 45.4%. from 159.3 in 2003 up to 114.0. Return on working capital decreased by 14.4% from 34.2 in 2003. up to 19.8% in 2004
The profitability of fixed assets characterizes the profit before tax per 1. rub. fixed assets, it grew by 3.7%.
4) SOLVENT ASSESSMENT
Absolute liquidity ratio
= cash(260) + short-term financial. investments (250) / short-term liabilities;
Quick
ratio = (Cash + Short-term financial investments + Accounts receivable) / Current liabilities;
Current
ratio = (Current assets - Deferred expenses) / Current liabilities;
The absolute liquidity ratio shows what part of short-term liabilities can be repaid using available cash.
The quick liquidity ratio shows the degree of repayment of short-term obligations with cash; short-term financial investments and accounts receivable increased this indicator by 1.75;
The current liquidity ratio shows the degree to which short-term debt is covered by current assets; an increase of 0.03 was noted in this indicator.
Due to the fact that liquidity indicators do not correspond to standard values (Current liquidity ratio is norm -2, Quick liquidity ratio is norm -07.-1), we will calculate the coefficient of recovery and loss of solvency:
Recovery and loss of solvency ratio = Current liquidity ratio (2004) + 6/12 (Current liquidity ratio (2004) - Current liquidity ratio (2003)) / 2
Coefficient of recovery and loss of solvency = (1.33 + 6/12 (1.33-1.36)) / 2 = 0.66
Since the coefficient of restoration and loss of solvency is less than 1, the company cannot restore its solvency within 6 months.
5) FINANCIAL STABILITY RATIO
| Indicator name | Deviation |
| Equity | |
| long term duties | |
| Short-term liabilities | |
| Borrowed capital (line 590+610+620+630) | |
| Balance currency | |
| Financial autonomy ratio | |
| Financial dependency ratio | |
| Current debt ratio | |
| Financial risk ratio | |
| Debt coverage ratio with own funds |
Financial autonomy ratio
= Own capital/Balance sheet currency;
Financial dependency ratio
= Borrowed capital / Balance sheet currency;
Current debt ratio
= Current liabilities/ Balance sheet currency;
Debt coverage ratio with own funds
=Equity capital/Debt capital;
Financial risk ratio
= Debt capital/Equity capital.
The enterprise's financial dependence on external sources decreased - the share of equity capital increased by 146, but borrowed capital increased by 13,654, and the financial risk coefficient increased accordingly by 0.18. The financial autonomy coefficient decreased by 0.08, the current debt ratio increased by 0.06, and the debt coverage ratio with own funds decreased by 0.81.
6) ANALYSIS OF INDICATORS NET ASSETS
Net assets
= Current assets - (Loans and credits + Accounts payable + Debt to founders for payment of income + Other short-term liabilities);
Own working capital
= Current assets - Non-current assets.
In the analyzed period, the net assets of the enterprise increased by 5360, which indicates an improvement in financial stability, however, the enterprise cannot finance its activities itself through working capital because The indicator Own working capital has a negative value.
At the end of winter and beginning of spring, all organizations are actively preparing financial statements for 2016. Let's talk about one of the key indicators of any enterprise - the book value of assets. Where can I see it on my balance sheet?
for 2016 and how it will help.
Net assets and net profit
Net assets are also analyzed with other economic and financial indicators of the organization. So the dynamics of growth of net assets is compared with the dynamics of changes in sales revenue and net profit. Sales revenue is an indicator reflecting the efficiency of an enterprise's sales and production systems. Net profit is the most important indicator of the profitability of a business; it is through it that the assets of the enterprise are primarily financed. As can be seen from the figure below, net profit decreased in 2014, which in turn affected the value of net assets and financial condition.
Composition of assets and where to look
Any specialist who has ever dealt with accounting knows the words “balance sheet” and “organizational assets.” If we explain their meaning in accessible language, it turns out that the book value of assets
- this is a certain number of means and benefits that can be expressed in monetary terms.
Speaking in the language of accountants, what is the book value of an enterprise’s assets?
, then this is the amount of all the company’s assets in cash, which is clearly shown in the accounting. balance.
Assets can be:
- non-current - they are summarized in line 1100 of the balance sheet;
- negotiable – written in line 1200.
All main types of property and intangible assets are classified as non-current. They appear on the balance sheet at their residual value (at which they were received/purchased, taking into account subsequent aging, wear and tear and revaluation carried out by the company).
Working capital includes assets, the use of which in the activities of an enterprise to achieve financial success is quite frequent. They are involved for 12 months or another established cycle. These include:
- materials needed for production;
- debts of debtors to the company;
- monetary assets and the like;
- VAT on property acquired by the enterprise;
- financial investments, etc.
It is not difficult to find the book value of assets: this is the line
1600 in balance. It shows the amount of both current and non-current assets.
Thus, there is only one option where to look at the book value of assets in the balance sheet
: it is registered in line 1600 of the balance sheet.