Analysis of fulfillment of contractual obligations and product sales
Analysis of the fulfillment of contractual obligations in the process of selling products is an integral part of the overall sales analysis.
The analytical activities themselves when researching sales depend on an important point: whether revenue is determined at the enterprise by shipping goods or by paying for them.
Take our proprietary course on choosing stocks on the stock market → training course
Analysis of implementation usually occurs in the following areas-objects:
- Study of the volume of products sold (actual indicators are compared in dynamics and with the plan, factors influencing the sales volume are identified);
- Studying sales in terms of product range and range, identifying and investigating the causes of discrepancies with standards;
- Consideration of product quality indicators: individual, general and indirect (sanctions for low-quality products and defects); study of the influence of quality indicators on cost indicators: output volumes, revenue, profit;
- Studying the structure of products: the preservation of the planned proportions between types of products in the total volume of their output is considered; this is a very important point, since the structure of manufactured (sold) products affects all key economic values of the company: profitability, cost, profit, material intensity, etc.;
- Study of the rhythm of production - that is, the uniformity of product release in accordance with the planned schedule, taking into account the assortment and nomenclature; rhythmicity is the key to meeting deadlines for orders, irregularity is the reason for the deterioration of the organization’s economic performance;
- Shipments and sales are analyzed - actual indicators are compared with planned values and values of previous periods, growth rates are calculated, and appropriate conclusions are drawn.
When studying sales volumes, be sure to also examine the fulfillment of obligations under the contract. The percentage of completion is calculated using the following formula:
Kisp = (OPRpl – OPRn): OPRpl * 100% , where
K – performance coefficient;
OPRpl – planned volume of product sales in accordance with existing agreements and contracts;
OPRn – volume of products not delivered under contractual obligations.
Indicators of fulfillment of obligations under contracts are examined from the beginning of the year on a cumulative basis. They are calculated in terms of individual contracts, delivery times, and types of goods.
Factors of change in product sales volume
The main factors influencing the volume of sales of goods include:
- Fluctuations in product output volumes;
- Fluctuations in the balance of work in progress and intra-economic turnover;
- Changes in the number of remaining unsold goods;
- Change in shipment volumes.
Main aspects of accounting for finished products
Legal regulation in the field of accounting prescribes accounting for products produced by business entities as inventories. You can familiarize yourself with all the most important aspects of accounting for this type of asset in the following regulatory documents, presented clearly in Figure 1.
In accordance with the provisions of PBU 5/01, finished products are products produced for the purpose of sale, for which all the following conditions are simultaneously met:
- it has gone through all the necessary stages and production processes in accordance with the technology of its manufacture or processing;
- its quality indicators meet the requirements of regulatory documents or agreements reached with the buyer;
- it is shipped to a storage location or directly to the buyer.
Note 1
Most often, economic entities produce several types of products. Therefore, the accounting program must be configured with analytics based on various criteria, which depend on the needs of the organization, the profile and specifics of its activities.
Accounting for finished products at the place of their storage is necessarily organized in physical terms, and accounting, in turn, will translate everything into monetary measures. Accounting data may contain the following analytical information about finished products:
- Name
- storage;
- brand;
- vendor code;
- type-size;
- model, etc.
Options for the sales volume analysis methodology
There are two main options for researching sales volume. They depend on how the organization recognizes revenue.
- The first option involves recognizing revenue from shipment, that is, the number of goods shipped is considered equal to the number of products sold.
- In the second option, revenue is recognized upon payment, that is, not immediately upon shipment, but only after receipt of money from the buyer into the account (by the way, this can happen before the goods are sent to him; in this case, the fact of shipment itself is not taken into account).
Who must submit the declaration
Reporting is intended for both individual entrepreneurs and organizations. The main condition for submitting the declaration is that the business produces in Russia or imports into the country goods or packaging that is included in the list from the order. If a manufacturer uses packaging from this list for its goods or imports goods in such packaging, then it must also submit a declaration for this packaging, and if the product itself is included in the list, then also for it.
It is not clear whether you need to report? This article will help. Do you have an atypical situation? Look for a clue here.
How to calculate product sales volume (formula)
Important!
The formula for calculating sales volumes depends on the revenue recognition method established in the organization’s accounting policy. The possible options were discussed in the previous paragraph.
If we are talking about recognizing revenue from shipments, then the balance of products sold takes the following form:
RPr = OGPn + VPrT – OGPk , where
Rpr – sold products;
OGPn, OGPk – balances of finished products at the beginning and end of the study period;
VPRT – production of commercial products.
The following equality holds here:
RPR = OtgrPr , where
Rpr – sold products, and OtgrPr – shipped.
If the enterprise has chosen another option - recognizing payment revenue - the following equality is satisfied:
RPr = OGPn + Tone + VPrT – OGPk – Current , where
OGPn, OGPk – balances of finished products at the beginning and end of the study period;
VprT – production of commercial products;
Ton, Current – balances of shipped goods according to data at the beginning and end of the period.
Where is the volume of work performed in the balance sheet?
In a grocery store, 2.5 kg of Belochka sweets were sold per shift at a price of 345 rubles per kg;
25 loaves of white bread at a price of 31 rubles per loaf; 3 packs of “Piala” tea for 70 rubles; 2 packs of Dobrodeya noodles for 65 rubles. Let's determine the amount of revenue per shift that is handed over to the collector: TR = 2.5*345+25*31+3*70+2*65; TR = 1977.50 rub. Based on the above formula, we understand what methods can be used to influence revenue. Either increase the retail (in other cases selling) price, or increase the volume of goods (or products) sold. In the first case, the limiting factor will be consumer demand. In the second, there is a minimum profit margin (after all, the enterprise must remain profitable). Example.
Determine the change in the travel agency's revenue based on information about the price and number of vouchers sold.
What is enterprise profit and its types
Important Net profit is an important element in analyzing the efficiency of an enterprise. This is the balance of gross profit after taxes. Simply put, these are the funds that remain at the free disposal of the organization.
Using these finances, the company forms reserve capital, increases working capital, buys new equipment, and acquires shares of other companies. Part is spent on employee incentives: bonuses, corporate events, travel vouchers, gifts, assistance in purchasing housing or treatment.
The size of the indicator depends on several factors:
- revenue amount;
- production cost;
- amount of taxes;
- volume of other income and expenses.
Negative profits are called net losses. Many enterprises turn out to be unprofitable, despite successful activities during the year.
How to calculate sales revenue?
Naturally, today all the conditions that the direct counting method presupposes are practically impossible to fulfill, therefore, as a rule, the second method is used. Calculation method This approach is based on adjusting the balances of the sold product (work, services) of input and output nature. For the calculation, it is necessary to use the following algorithm: - B = O(init.
) + T – O(k) (formula: sales revenue using the calculation method). — B – revenue from sales of products (works, services). — O(beginning) – balances of finished products at the beginning of the planning period that have not yet been sold. — T – goods intended for release in the corresponding period. — О(к) — balances of finished products at the end of the planning period that were not sold.
Balance sheet profit formula
It is this indicator that is taken as the basis for calculating income and different types of profit from the company’s core activities. It does not include expenses or cash receipts from non-operating activities.
The calculation algorithm is very simple - information on sales volumes and the cost of a unit of goods are taken. If the price changed during the reporting period, revenue is calculated based on each such change.
Attention Other income that the company received not from the sale of goods is not taken into account. Formula for calculating revenue This indicator, like the profitability formula, is calculated taking into account the size of sales completed and the current cost.
How to correctly calculate the net profit of an organization?
Income from other sales Income from other sales is the total result of sales operations for the sale of goods and services that are not related to the main production activities of the company. The total monetary and profitable profit from other sales is affected by:
- sales of fixed assets;
- sale of intangible assets;
- profitability of inventories;
- sale of financial assets;
- material wear and tear;
- rental of premises;
- deductions for “frozen” production capacities and facilities;
Non-operating income Non-operating income is the amount of funds from operations that do not relate to the main production processes and are not related to the result of fixed assets, other income, performance of work and services.
Net profit: formula for calculating the balance sheet
Accrued calculation method: TR = Res.p (n) + GP - Res.p (k), where
- Ost.p (n) and Ost.p (k) – balances of finished products at the beginning and end of the reporting period;
- GP – production of finished products that are planned to be sold.
All calculations are expressed in monetary terms (rubles, dollars, euros, etc.). Examples of calculations The money that comes into the company as a result of the sale of goods or the provision of services is called revenue.
They are a means of reimbursing the company's costs and generate profit. Also, financial income can come from transactions with securities, leasing of objects, etc.
Example No. 1 Hydrosila LLC released products worth $25,000 in June; at the beginning of the reporting period, goods worth $8,000 were in the warehouse. At the end of the month, there were actually $12,000 left in the finished goods warehouse.
How is revenue reflected on the balance sheet?
Next in order of decrease are marginal (minus variable costs), gross (minus technological cost), sales (minus full cost), operating (minus other expenses with the addition of other income and interest payable), balance sheet (minus other expenses with the addition of other income), net (less taxes). How to calculate the profit of an enterprise All types of profit are calculated on the basis of revenue, which is equal to the product of sales volume and unit price.
Certain cost items are subtracted from primary income and thus each type of profit is found. General calculation formulas Revenue is calculated using the following formula: TR = P * Q, where TR (total revenue) – revenue, rub.; P (price) – price, rub.; Q (quantity) – quantity of products, rub.
Formula: sales revenue. How to calculate sales revenue?
Analysis using an example“) Operating profit reflects the efficiency of production or other type of core activity of the enterprise. Profit before taxation is profit without taking into account other costs/income from non-core activities. As a result, net profit, cleared of all costs and expenses, shows the integral result of the functioning of the enterprise.
Goals and directions for using the net profit indicator The amount of net profit characterizes the efficiency of the entire company/enterprise and is used for various purposes by various external and internal stakeholders (individuals, users). User/stakeholder Purpose and areas of use Investors Purpose: assessment of investment attractiveness Assessing the size and dynamics of changes in the net profit of an enterprise to analyze its investment attractiveness.
How to determine revenue from sales of goods, services or products
As you can see, there is a close relationship between them, and it can also be noted that there is a positive growth trend in the enterprise’s net assets, this indicates that funds are being directed to expand production capacity, which in the future should increase the amount of net profit received.
Is the credit rating of a company related to the amount of net profit? In my research, I analyzed the relationship between the amount of net profit for the Rosneft OJSC enterprise and the credit rating of the international agency Standard & Poor's.
There is a close relationship and correlation shown in the figure below - this proves the importance of such an indicator as net profit as a criterion of investment attractiveness not only in the national space, but also in the international arena.
Net profit of the enterprise. formula. methods of analysis and purposes of use
An increase in net profit increases the size of dividend payments and allows you to attract additional buyers/shareholders. Suppliers Purpose: assessing the sustainability of operation The net profit of an enterprise serves as an indicator of its sustainability of development.
The higher the net profit for the reporting period, the higher the ability to pay suppliers and contractors on time for raw materials.
Top managers Goal: assessing the sustainability of financial development The amount of net profit and the dynamics of its change serves as a guideline for developing strategies and plans to increase it at the operational level.
Planning of contributions to reserve funds, wage funds and production funds. Methods for analyzing the net profit of an enterprise Let's consider various methods for analyzing the net profit of an enterprise.
Source: https://kpa.ru/obem-vypolnennyh-rabot-v-balanse-gde-nahoditsya/
Analysis of product sales, overall profitability of sales
In general, the volume of products sold can be calculated using the formula:
ORPr = KPr(x) * TsPr(x) , where
KPr(x) – quantity of products of type x;
TsPr(x) – price of product type x.
Example. During the quarter, the plant produced 200 parts A at a price of 200 rubles and 400 parts B at a price of 100 rubles. This means that the volume of products sold in monetary units was:
200 * 200 + 400 * 100 = 80,000 rubles.
This so-called absolute indicator is compared with planned values and levels of previous periods, and growth and growth rates are also calculated from it.
But, as you know, analysis is not limited to the study of absolute indicators. For a more reliable assessment of the enterprise's performance, relative indicators are needed to demonstrate the effectiveness of certain actions. When studying sales volumes, this coefficient is the total return on sales, which is calculated as follows:
RentPr = PPr/Vyr , where
PPr – profit from sales;
Vyr – revenue.
Depending on the purposes of the study, the indicators in the numerator may change. For example, if it is necessary to determine net profitability, then net profit is used instead of operating profit.
Profitability is also studied in dynamics and in comparison with planned values. The factors influencing it are studied. Thus, under other constant circumstances, an increase in the selling price of a unit of a product always leads to an increase in profitability.
Assessment of the dynamics of the volume of products sold
The volume of products sold is generally calculated using the following formula:
ORPr = Vpr + OGPrn – OGPrk , where
ORPR – sales volume;
Vpr – gross product;
OGPRn, OGPRk - the balances of the finished product, respectively, at the beginning and end of the period (usually a year).
The formula contains the concept of gross product. This definition is worth understanding in more detail.
Gross product is the cost of all manufactured products (work performed) for a specific period, including production that has not yet been completed.
Along with this concept, there is also a commodity product - this is the volume of products that are ready for sale, that is, processed accordingly.
In some cases, the volumes of gross and commercial output are equal.
Example. The annual output of products at the plant amounted to 400,000 rubles. At the same time, the balance of finished products at the beginning of the year amounted to 45,000 rubles, and at the end - 70,000 rubles. Accordingly, the annual sales volume is calculated as follows:
400,000 + 45,000 – 70,000 = 375,000 rubles.
Sales volume indicators are studied in dynamics over a certain period. Let's look at how this happens using a specific example. Sales data for the drilling equipment plant over the five-year period are presented in the table.
| Quantities | 1st year (base) | 2nd year | 3rd year | 4th year | 5th year |
| Comparison with base period (%) | 100 | 109,7 | 122,2 | 133,2 | 151 |
| Comparison with the previous period (%) | – | 109,4 | 111,6 | 110,1 | 110,4 |
The average annual growth rate is calculated using the weighted average as follows:
Т = N√Т1*Т2*Т3*…ТN
Substituting the numbers from the table into the formula, we get:
4√1,094*1,116*1,101*1,104 = 1,104 = 110,4%
We conclude that over the five-year period, sales volume increased by 51% with an average annual growth rate of 10.4%.
ANALYSIS OF KEY PRODUCTION PERFORMANCE INDICATORS
Before considering product output indicators, it is advisable to briefly familiarize yourself with the production cycle of a meat processing plant in order to understand how it develops the cost of finished products (see figure).
Of the four production divisions of the meat processing plant, only one produces another type of raw material from one type of raw material (the slaughterhouse). In the other three, at the end of the technological process, both a new type of raw material and finished product . This feature of food production involves analyzing the work for each department separately.
Additionally, for the first three divisions, it is necessary to analyze the indicators for each type of raw material, since there are differences between them in terms of technological losses and processing costs.
At the first stage of the analysis, the head of the economic service is obliged to assess how effectively each of the divisions worked in the reporting period. To do this, key production performance indicators are analyzed. Each company can choose the list of indicators independently, but it must contain not only summative or quantitative, but also qualitative assessments of product output.
For a meat processing plant, the key indicators are:
- production volume of half carcasses in kilograms;
- yield of secondary raw materials as a percentage of the weight of incoming raw materials;
- production cost in rubles per kilogram;
- slaughter costs in rubles per kilogram;
- output per person in kilograms;
- capacity utilization as a percentage;
- average daily storage volume in kilograms;
- storage costs in rubles per kilogram;
- cost of storing one ton in rubles;
- material consumption of finished products;
- cost of finished products.
Key production performance indicators for the first half of 2018 are presented in table. 1.
Table 1 shows the data most important for assessing production efficiency. Based on them, one can draw conclusions about how successful the implementation of the plans for the first half of the year was, and which departments of the meat processing plant were unable to achieve their goals.
The format of the article does not allow us to consider each of the indicators, so let’s move on to the second stage of analyzing production performance. Further analysis will allow us to understand what factors determined the production cost of production.
Disclosure of reserves for increasing sales volumes
The final goal of all analytical actions is to identify reserves for growth in sales volumes. This is necessary both to increase profits (profitability) and to reduce the balance of finished products in the warehouse (and, accordingly, reduce the cost of their maintenance, reduce the risk of damage, etc.).
Such reserves can be hidden in increasing the selling price, increasing production volumes to an optimal value (ensuring maximum profit at appropriate cost levels), advertising campaigns, searching for regular reliable customers (and strengthening relationships with them by providing discounts for “loyalty”, for example).
Assessment of production volume indicators in standard hours
When estimating production volume, you can make a mistake if you use only the cost indicator. This is because this assessment in terms of value is strongly influenced by the process of changing the structure of output and purchasing prices for raw materials.
Changes in the structure of manufactured products depend on a number of reasons:
- Lack of technological equipment;
- Failures and interruptions in the organization of logistics;
- Increasing the cost of manufactured goods.
When the structure of manufactured products fluctuates, cost indicators do not in any way characterize labor costs. This is due to the fact that the cost of a product includes the totality of real labor and material costs for its production. This combination has its own indicators in different types of products. Therefore, when assessing production and sales volumes, labor-intensive, material-intensive and capital-intensive production are distinguished. Since a direct relationship cannot be established between labor costs and prices for the created goods, changes in the structure of production have a serious impact on the assessment of production volumes in terms of their value.
This fact leads to the need to have more effective tools for assessing production volumes and sales of products at a particular enterprise. The analysis algorithm includes an assessment in standard hours and the establishment of standard wages.
Estimating the volume of products produced in advance involves determining the indicator of the quantity of the product that is produced through the own efforts of the business entity, its labor productivity, the maintenance of funds, the amount of material resources expended, and the percentage return on the produced goods.
To estimate the volume of manufactured products in terms of standards fulfilled for a specified period of time (standard hours), it is necessary to multiply the quantity of planned products by type by the actual quantity of product produced. The resulting total number of standard hours spent on creating a separate product is summed up and thus the total volume of manufactured products is obtained in standard hours. Next, calculations are made of the growth rate of production volumes in standard hours and the implementation of the plan is determined.
All required data, including labor costs in standard hours per unit of product produced, can be calculated using Form No. P-1 (for product output) from the business plan or from operational and technical accounting materials.
Estimation of production volumes does not reflect the complexity of the technological process, as well as the quality and volume of labor expended, which is determined in standard hours. This is its key drawback.
The assessment of production volumes in standard wages is determined based on the actual quantity of products produced according to the plan, multiplied by the wage rate per unit of product produced. After summing up the costs of standard wages for all products, the planned and implemented production volumes, expressed in standard wages, are determined.
Read the article: Countertrade and its features
Reflection of sales of finished products in accounting
When shipping products to the buyer, the following posting is made:
Dt 62 “Buyers” Kt 90.1 “Sales, revenue”.
Further accounting entries depend on the cost at which the enterprise records products - actual or planned.
In the first case (if goods are accepted for accounting at actual cost), write-off is carried out through the following posting:
Dt 90.2 “Cost of sales” Kt 43 “Finished products”.
For the second option, if products are accounted for in standard quantities, entries are made using account 40 “Product Output”.
Dt 43 Kt 40 – products are accepted for accounting at planned cost;
Dt 90.2 Kt 43 – write-off of products (at planned cost);
Dt 40 Kt 20 “Production” - a reflection of the actual cost calculated at the end of the month;
Dt 90.2 Kt 40 – overexpenditure is written off, the excess of the actual cost over the planned one;
Dt 90.2 Kt 40 STORNO - savings are reflected, that is, the excess of the planned cost over the actual one.
Operations that are directly related to the process of selling manufactured products are accounted for using account 44 “Sales expenses”.
Where is the volume of work performed in the balance sheet?
To make accounting entries for the receipt of revenue, it is necessary to comply with the principles of income recognition laid down by the Ministry of Finance in the Accounting Regulations “Organizational Income” PBU 9/99:
- the company has the right to funds from sales, which is supported by documents. In this case, the counterparty accepted the service or received the rights to the product sold to him;
- the volume of income and expenses associated with sales can be calculated;
- the firm has confidence that the transaction will take place and will bring economic benefits through the receipt of money or other property.
To carry out account assignment confirming the fact of sale, documents must correspond to standard samples or be drawn up according to a form developed and approved by the company.
If all criteria are met, the proceeds from the sale are reflected in the accounting account of Section VIII “Financial Results”. Otherwise – as accounts payable in section VI. What account is provided for revenue in the accounting department is indicated by the Chart of Accounts (approved by Order of the Ministry of Finance No. 94n): this is account 90 “Sales”.
The accounting record of assets received during the sale of goods and services consists of the receipt of money, the cost of the property received and accounts receivable for products and services sold.
When asked by an entrepreneur how revenue is accounted for in account 90 with or without VAT, the answer is given by the same Chart of Accounts: the amount from sales is accounted for at the sales price of the products sold, taking into account duties, excise taxes, and VAT.
Financial terminology and reporting involve many fairly complex concepts. If you are not sure of the exact understanding of the economic terms that characterize business performance, our articles will help you understand the definitions:
- “What is the difference between margin and profit?”;
- “What is the difference between profit and revenue”;
- “What is the difference between margin and markup?”
But, of course, no information can replace the live assistance of a qualified specialist. It is better to trust financial and accounting issues to professionals - this will save your time and help avoid annoying misunderstandings. Take note: you can always get expert help by contacting the Glavbukh Assistant service.
Reflection of revenue on account 90
A document that standardizes the account in which sales revenue is reflected is the Chart of Accounts for accounting the financial and economic activities of organizations. According to Section VIII of the regulations, accounting under account 90 “Sales” registers information on the income/expenses of the company’s main business and balances its financial results.
Account 90, which reflects revenue, is one of the most difficult to account for and its specificity is due to the fact that sales include not only the revenue side, but also the expense component of a multi-stage process. The plan provides for the opening of sub-accounts:
- 90/1 “Revenue” - for recording receipts of assets that are recognized as revenue;
- 90/2 “Cost of sales” - for grouping costs by products sold;
- 90/3 “Value added tax” - to separate VAT from the sales value of products sold;
- 90/4 “Excise taxes” - to allocate the amount of excise duty from the selling price of products sold;
- 90-5 “Export duties” - for accounting for export duties (an additional open sub-account is used);
- 90/9 “Profit/loss from sales” – for balancing the financial result from sales for the month.
Subaccounts 90.3-90.5 provided for by the Plan are not used by all organizations.
Their use is related to the specifics of commercial activity, but according to the synthetic (generalized) 90th account, it is necessary to open additional analytics by type of sales - the range of goods, products, types of work, services, etc. The company organizes a detailed division independently for monitoring results and effective management.
The specifics of accounting are as follows: entries in subaccounts of the accounting account in which revenue is kept are recorded cumulatively throughout the year.
Every month it is necessary to compare the turnover of subaccount 90/1 (for credit) and subaccounts 90/2 - 90/5 (for debit) and the resulting total is transferred from subaccount 90/9 in final turns to another synthetic account 99 “Profits and losses”.
That is, at the end of the month the synthetic “Sales” account has no balance, and the balance of the subaccounts at the beginning of the next month serves as the initial one. The subaccounts themselves, except for 90-9, are closed annually to subaccount 90/9.
Monthly calculation of sales results:
- Counting the turnover of subaccounts - credit 90/1, debit 90/2 - 90/5.
- Deduction from the amounts of turnover 90/2 - 90/5 turnover 90/1.
- Posting Dt 99 Kt 90/9 for the amount of the positive difference - loss,
or
Posting Dt 90/9 Kt 99 for the amount of the negative total - profit.
- Repeat accounting transactions next month until the end of the year.
Closing account 90 by year:
- Closing subaccounts 90/1 - 90/5 by transferring to subaccount 90/9 with entries Dt 90/1 K90/9, Dt 90/9 Kt 90/2, etc., after which their balance should be equal to zero.
- Control of closing subaccount 90/9 - it should be zero after all account assignments.
- Opening account 90 in the next reporting period with zero balances on all subaccounts.
As you can see, the operation of the account is complex and requires not only monthly control of turnover and balances of analytical data, but also the correctness of the final annual entries. Outsourcing accounting becomes the right decision for an entrepreneur, guaranteeing the correct registration of transactions, as well as the calculation of taxes in the “optimization” mode.
Revenue in accounting: postings
As a standard, in the standard version, postings to the “Sales” account are divided into two types of correspondent entries - debiting and crediting account 90. Having considered which accounting account the revenue is reflected in, let’s move on to practical entries using an example:
In the reporting period, Vasilek LLC sold its products for 240,000 rubles. The cost amounted to 160,800 rubles. Funds have been received into the bank account. The company is a VAT taxpayer; products sold are taxed at a rate of 20%.
- Dt 62 Kt 90/1 for 240,000 rubles. - Shipment of goods.
- Dt 90/2 Kt 43 for 160,800 rub. - write-off of cost.
- Dt 90/3 Kt 68 for 40,000 rubles. – VAT 20% on the sales price.
- Dt 90/9 Kt 99 for RUB 39,200. – profit from the transaction.
- Dt 51 Kt 62 for 240,000 rubles. – crediting money to the account.
Let’s assume that for the entire year, sales receipts amounted to 1,068,000 rubles. (balance 90/1), of which VAT is 178,000 rubles. (balance 90/3). Cost for the year is 560,000 rubles. (balance 90/2) and the result from sales by the end of the year was profitable 330,000 rubles. (balance at the end of the period 90/9). Then the final turnover for the year is as follows:
- Dt 90/1 Kt 90/9 for RUB 1,068,000.
- Dt 90/9 Kt 90/2 for RUB 560,000
- Dt 90/9 Kt 90/3 for 178,000 rub.
- Result – account 90/9 is reset to zero.
These postings are indicated for recognizing revenue upon shipment of goods. Subaccount 90/1 corresponds with cash settlement accounts directly for retail sales and then the entry Dt 50 Kt 90/1 “receipt of revenue” is made.
In general, the principle of operation of the revenue account is similar for different types of activities with the difference that when writing off costs, the corresponding accounts for production expenses or the cost of resold goods are used.
>Learning the basics of accounting. Which account is the revenue reflected in?
Materials Sale of fixed assets
Why does it apply to credit 90 and 91?
The division of income into “regular” and “other” is not established by law; each organization determines them independently.
Important. The usual type of activity is not the one that the organization ascribes to in the Charter and makes it the main one when registering, but the one that is actually carried out.
In general, income from ordinary activities for manufacturing organizations includes the sale of manufactured products, for retail organizations - the sale of goods, for transport organizations - the sale of transport services.
Then the rental income from such organizations will be other income if the rental of property is unsystematic (for example, a production organization leases temporarily unused production space or equipment).
We talked about how revenue differs from income and other accounting concepts in this material.
But if leasing is the main activity of the organization (for example, cars are purchased for rent to taxi drivers), real estate is purchased by an agency for resale, then such income is accounted for using account 90. Proceeds from the sale of everything else are credited to account 91 (as is considered you will find out such revenue from sales). For certainty, an organization can prescribe the types of income from ordinary activities and others in its accounting policies.
Step-by-step instructions on how to reflect the implementation (including in 1C)
Let's look at the most common transactions for the sale of other property in the 1C program version 8.3.
Materials
- Go to the “Sales” section, document “Sales (acts, invoices)”.
- When creating a document, select the “Goods (invoice)” type.
- In the document, select the counterparty, the contract (it should look like “with the buyer”), and the materials warehouse.
- Using the “Settlements” link, fill in the accounts for accounting for settlements with the counterparty and settlements for advances, payment terms and settings for offsetting the advance.
- Determine the method of calculating VAT - “VAT in total” or “VAT on top”.
- Fill out the tabular part: for each material, select a name from the “Nomenclature” directory, indicate the contract price, quantity, and VAT rate.
- By clicking on the “Accounting Accounts” link, the corresponding tab is automatically filled in: material accounting account from the directory (10), income accounting account (91.01), other income and expenses item “Sale of other property”, write-off account for the cost of material sold (91.02), VAT attribution account (91.02 “Other expenses”).
- To issue an invoice, click the “Write an invoice” button.
- Print the document in any of the options: TORG-12, invoice, invoice for materials release on the M-15 side.
Source: https://pavelbeliy.com/obem-vypolnennyh-rabot-v-balanse-gde-nahoditsya/
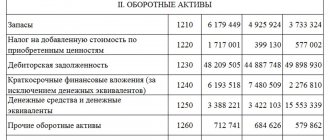
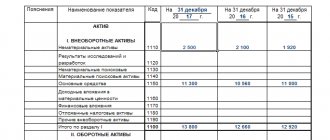
Volume of product sales in the balance sheet (line)
The balance sheet does not provide a separate line to reflect revenue (or the volume of goods sold). After all, this form of reporting shows the company’s assets, but the sold products, in essence, are no longer assets.
But the revenue is reflected in form number 2 - the Profit and Loss Statement. Here it is shown on line 2110 of the same name.
The balance sheet may reflect products that have already been shipped to the buyer (a sales contract has been concluded with him), but the money for it has not yet been credited to the account. In this case, the organization has accounts receivable, which are shown on the balance sheet line of the same name 1230. It is important to understand that in the balance sheet, revenue on this line is entered with VAT, while in the profit and loss statement a net indicator is used: revenue cleared of tax.
Profit from the sale of the product is reflected in balance sheet line 1370 “Retained earnings/uncovered loss.” Here, the operating profit is supplemented by the profit received from other operations in all types of activities of the company (both main and other).
Reliability of information on finished products
According to one of the accounting principles, financial statements, including the balance sheet, must contain only reliable information. This means that balances on all accounts, including balances on finished goods (GP) accounts, must reflect the real state of affairs in the company.
In this sense, the accountant faces a difficult task. He needs to collect information about all production processes: the movement of inventories and valuables, their consumption, depreciation of fixed assets and intangible assets, wages and insurance premiums, as well as all other expenses that take part in the formation of the cost of the enterprise in order to establish the real value of the asset "Ready products". After all, finished products are the result of the entire production activity.
After writing off the sold GP at cost, a balance is formed in total terms by the end of the final period. It will be included in line 1210 of the balance sheet.
The balance sheet itself must be prepared by all legal entities at the end of the year. But company owners often require provision of intermediate information about the economic situation of the enterprise and assessment of financial potential in close to real time. Approximate, since it takes accountants time to draw up any balance sheet, even an intermediate one.
How to calculate the volume of products sold according to the balance sheet
Reporting is the main source of information for analyzing all the economic characteristics of any enterprise. After all, it presents the final indicators for the time period under study.
To calculate the volume of goods produced and sold using reporting forms, we will need the following lines:
- 2110 “Revenue” from the income statement;
- 2120 “Cost of sales” from the income statement;
- 12105 “Inventories” from the balance sheet.
The volume of products sold is equal to the number on line 2110 of the second form.
Production volume is calculated as follows:
the amount on line 12105 at the end – the amount on line 12105 at the beginning + the amount on line 2120.
When and who expects the declaration
The declaration is submitted annually, before April 1 of the year following the reporting year. The delivery location depends on the type of respondent (Resolution of the Government of the Russian Federation dated July 25, 2018 No. 868):
- Manufacturers submit a declaration to the territorial RPN authority to which the reporting organization or entrepreneur belongs.
- Importers - to the Central RPN.
- Manufacturers and importers at the same time also report to the Central RPN. Please note that importing manufacturers submit one set of reports, without breaking it into two parts - for manufactured and imported goods/packaging. To prevent such a mistake, in Kontur.Externe you need to select the type of activity “Manufacturer-Importer” on the title page, after which you generate one report, where you include both manufactured and imported goods/packaging.
Assessment of factors influencing production volume
Estimating the volume of product sales at an enterprise consists of the sum of many different factors. All indicators that affect the volume of production and sales of products can be grouped as follows:
1) Factors that demonstrate the organization’s provision of fixed capital, such as monetary resources and the frequency of their use;
2) Factors that demonstrate the provision of the organization with material resources (raw materials, materials, energy resources, etc.), as well as the use of these material resources;
3) Factors that provide the organization with personnel (human resources) and their use in production;
4) Factors that are interconnected with the introduction of innovative techniques at the enterprise, updating technical equipment and producing new products;
5) Factors that interact with market movements and consumer reactions;
6) Factors related to market performance:
- product prices;
- competitive quality of goods;
- market saturation with similar products;
- consumer purchasing power;
- degree of consumer confidence in the product;
- characterization of the mood of consumers of the product;
- determination of target market directions;
- positioning the functional advantages of the product on the market;
- characteristics of professional training of marketing structures.
When assessing changes in the volume of sales of products, attention is paid to such points as the production and release of goods for the period subject to reporting, warehouse balances of manufactured products formed at the deadlines of the period of reporting activities.
The estimate of changes in sales volume is determined by the comparison method. In this case, changes in warehouse balances of finished products and shipped goods at the last date of the calendar period have a negative impact on the change in the indicators themselves.
During the development and implementation of the production program and at the time of signing contracts, it is important to pay attention to the consequences of changes in the economic conditions of contractual relations (calendar deadlines, volumes of product supply, prevailing prices for the cost of raw materials and manufactured products). A significant role is played by the influence of fluctuations in cost indicators in comparison with given standards on the total profit planned for the end of the period under study.
This problem when assessing production volumes and sales of products is solved through factor analysis
production program under certain contracts for the supply of products, taking into account the technology of its production, as well as the increase or decrease in costs for certain types of products. This analysis is based on how costs and profits are related to each other. At the same time, it is based on calculations of the impact of the number of sales and expenses on the profit margin.
Analyzing the volume of production and sales of products at a certain level of expenses, it is necessary to solve another problem: focusing on the planned revenue, calculate the required volume of sales to obtain a given profit and the volume of products produced to extract it. The dynamics of how the levels of fixed and variable costs, the volume of production and sales of products, and the cost of materials for each individual contract affect the overall profit can be calculated using the formula:
P = K × C – (MZ + Neg) – Rup – Mon,
Where:
P – profit;
K – natural value of the number of products of the same name;
P – unit price;
МЗ – material costs equivalent to the cost of certain types of products;
Otr – wage costs;
Rp – semi-fixed expenses;
Mon – profit of remaining unsold products.
This formula allows you to see how certain factors influence possible profits:
- Decreased product quality, decreased demand for the product, disruption of delivery stages and, as a result, refusal of the purchasing party’s agreements;
- Changes in planned production volumes at the initiative of the purchasing party;
- Changes in technology due to replacement of production materials, including due to delays or disruptions in their supplies;
- Changes in prices for materials, which leads to changes in prices for products.
From all of the above it follows that, having determined the key factors for assessing changes in production volumes and sales of products of an enterprise based on a factor model, it is possible to predict the expected profit from further sales of goods and minimize the influence of negative factors that inhibit the growth of sales volumes and product sales.
Read the article: Analysis of the competitive environment: main stages and methods
Cost estimates of production volumes
Estimating the volume of production and sales of products in monetary terms is the most plausible in determining the production and economic activities of an organization. This method is the most realistic in assessing the volume of production of goods that are diverse in their quality indicators and assortment.
Assessment of all volumes of production and sales of an enterprise's products according to cost criteria makes it possible to determine the volume of production in production associations and industries, in general for industry and the national economy on a national scale. This assessment makes it possible to monitor the dynamic growth of this indicator over time, calculate and analyze labor productivity, profit volume, degree of profitability and other parameters characterizing the operation of the enterprise for a specified period.
When determining the volume of cost of production and sales of products, the volume of products produced and the volume of their sales in monetary terms are taken into account. At the same time, a distinction is made between the cost of total (gross), nominal (commodity) and sold products. In addition, in determining production volumes at enterprises, the newly created value that was formed as a result of the labor activities of the enterprise’s employees is assessed. Such an assessment includes the following two indicators: the net production indicator and the value added indicator.
There are differences in the assessment of production cost volumes between these parameters. The “Net Product” indicator determines the amount of additional value that the enterprise produced over a specified period of time. The indicator “Added value” is the amount of additional produced and realized value in a certain period. The first indicator can estimate the volume of production and sales prices in constant prices, in which the volume of gross output is estimated. The “Added value” indicator evaluates products in prices for which the products were actually sold in a specified period of time.
Gross value
- this is the monetary equivalent of all products sold by an enterprise, association or industry for a certain calendar period.
In assessing production cost volumes, the enterprise's gross product takes into account:
- The total cost of all products produced according to technical specifications and standards for a specified period of time, combined with the cost that was spent on the needs of the enterprise itself (for example, on energy carriers and energy resources);
- Cost of produced semi-finished products;
- The cost of production services provided by the enterprise;
- Changes in work in progress balances.
Analysis of the volume of the cost of production of gross output, as a rule, is carried out on the basis of prices that are considered to be constant over a long calendar period. However, the possibility of performing this analysis in current prices for product sales is not excluded.
To assess the total volume and dynamics of production during the calendar period under study, the value of gross output is used.
Gross production volume is calculated using the formula: VP = TP + (Nk. g – Nn. g),
where VP is gross output;
TP – commercial products;
Nn. g, Nk. d – balances of work in progress at the beginning and end of the year.
Commodity value
is the cost of products produced by an enterprise that meet the requirements of technical specifications and standards and are intended for sale on the market. The assessment of product sales volumes includes: the cost of all products manufactured by the enterprise, except for the part that was used by the organization itself, and the cost of production commodity services that were provided by the enterprise.
Fluctuations in indicators of work in progress balances are not taken into account by commercial products.
The assessment of production volumes based on the cost of marketable products is organized taking into account the current level of market prices for these products in a specified period of time.
Cost of products sold
for third parties at prices set by the sales market. These products include industrial services provided by the enterprise.
The volume of planned products sold is calculated using the formula : RP = He + TP – Ok
,
where RP – sold products;
TP – commercial products;
He, Ok - the balance of unsold products at the beginning and end of the period.
Estimation of the cost of production volumes based on the value of newly created products (net products) is determined as follows. The value of gross output minus material costs and depreciation charges or as the total wages that were spent on the production of products, plus the expected profit from the results of its sales.
One of the possible formulas: PE = VP – MZ – JSC,
where PP is net production;
VP – gross output;
MZ – material costs;
JSC – depreciation charges.
A certain amount of goods and services produced and increased by an enterprise constitute added value.
All of the above indicators for assessing the cost, volumes of products produced and sold have different contents and ways of use. For example, the indicator of the value of gross product allows you to compare levels of production in different periods of time and makes it possible to determine the direction of growth in production volumes. Using the figure characterizing the size of the gross product, you can most accurately track the state of staff productivity.
The estimated cost of manufactured goods illustrates the volume produced for sale. When parameters such as the volume of gross and marketable output in assessing production volumes demonstrate the production results of an enterprise, then the indicator of goods sold additionally evaluates the economic activities of the organization.
In assessing the volume of production and sales of products, the volumes and cost of the product sold in certain time periods may differ significantly from the same parameters of commercial products. In case of weak demand or as a result of unsatisfactory sales of goods, the volumes of products sold will be significantly less than the volumes of the product produced. In contrast to this, it happens that when assessing production volumes, it is clearly visible that the volumes of products sold, even if there are balances in the warehouse, significantly exceed production volumes for a certain period of time. This phenomenon can be characterized as the dynamics of active sales.
There are also differences in the selling prices of goods. When setting the cost of products, you should use average prices, and when analyzing volumes of sold products, you should use the actual prices of a batch of goods in the time periods under study.
Read the article: Product market analysis is the first step to an effective marketing strategy
Tip 2: How to find production volume
You may be interested in: How to choose a name for an LLC
Determining the volume of goods is one of the fundamental operations that every economist should be able to do. of production are so common in economic and financial educational institutions .