Hello, Vasily Zhdanov, in this article we will look at the calculation of liquidity indicators according to RAS. Each business entity has data on its assets (property) and liabilities (sources of property). At the same time, some pieces of property can be easily sold if necessary, but selling others will take a lot of time, or it may not be possible to sell them at all. At one time, a company’s obligations can be long-term or short-term – that is, some debts need to be repaid in the near future, while others can be covered over a long period of time. To understand what portion of short-term debts can be repaid if a set of assets characterized by a certain rate of sale is sold, liquidity indicators are calculated.
Liquidity of a commercial enterprise: definition, classification
In the broadest sense, liquidity is the ability of the object of study to be converted into cash. If we talk about the efficiency of a commercial organization, liquidity refers to the ability of any asset (or an entire company, i.e., the totality of all available assets) to be sold in a short time at a price close to the market one . And the liquidity of a product is the possible speed of its sale at a nominal price.
Take our proprietary course on choosing stocks on the stock market → training course
From the definition of the concept of “liquidity” we can conclude that an asset will be considered the more liquid, the easier and faster it can be sold, while gaining its full value. Thus, values are usually divided into:
- illiquid (which are either completely impossible to sell or very difficult to sell),
- low-liquidity (implementation of which is possible, but difficult, and it will take a lot of time) and
- highly liquid (the sale of which is possible in a short time).
Balance sheet liquidity, grouping of balance sheet assets and liabilities
Let's consider the order of grouping Assets and Liabilities of the balance sheet of a Russian enterprise - Assets are arranged from most to least liquid, and the order of arrangement of Liabilities depends on the urgency of repaying the company's obligations:
| Grouping of Assets in the Balance Sheet | Grouping Liabilities in the Balance Sheet | ||
| A1 | Highly liquid (money, short-term investments) | P1 | The most urgent obligations (current accounts payable to counterparties, banks, employees, etc.) |
| A2 | Quickly realizable (short-term “receivables” - debts to the company, payments for which must be received no later than 1 year after the reporting date) | P2 | Medium-term liabilities (short-term loans and borrowings, reserves for future expenses, other short-term debts) |
| A3 | Slowly realized (current assets not included in groups A1, A2) | P3 | Long-term liabilities (liabilities taken from section IV “Long-term liabilities”) |
| A4 | Hard to sell (non-current assets – all) | P4 | Constant liabilities (company's own funds) |
According to the Balance Sheet, you can understand whether it is liquid by comparing the results for each of the groups of Assets and Liabilities. The following situation indicates absolute liquidity:
| Inequality | What does it mean |
| A1 > P1 | If you sell existing highly liquid assets, the company will be able to pay off its most short-term obligations. |
| A2 > P2 | After selling the company's quickly salable property, it will be possible to repay debts with an average repayment period. |
| A3 > P3 | With the proceeds from the sale of slowly selling assets, it is possible to pay off debts with a repayment period of more than 1 year. |
| A4 < P4 | The total value of an enterprise's hard-to-sell assets is less than the total amount of its equity capital. |
Balance sheet indicators of fixed assets
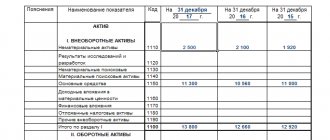
After the end of the reporting period, the resulting total fixed assets (balances) are posted to the financial statements. In the balance sheet of the enterprise, fixed assets are reflected on line 1150, the total amount of fixed assets (residual value) is derived by subtracting accrued depreciation from the original cost.
If fixed assets undergo a revaluation process, then the final (residual) value of the fixed assets is characterized as the replacement cost minus depreciation charges.
In the final register of the balance sheet of accounting, the residual value of fixed assets is determined as follows: balance for Dt01 minus balance for Kt02.
Let's look at an example:
TURNOVER BALANCE SHEET
Organization: Masterclass LLC
Period: 1st quarter 2021
From the example, we derive the residual value of the main objects:
- 58600 – 1800=56,800 rubles, this is the amount of fixed assets, which is reflected in the financial statements for the 1st quarter of 2021 on line 1150.
Balance sheet
Location (address) Volgograd, Mira street, no. 12
The main indicator of the effective performance and economic condition of an organization is the book value of the enterprise's assets.
The book value indicator is applicable for some calculations:
- Profitability indicates the amount of profit due to investments in equipment;
- Working capital turnover is a determination of the efficient use of assets.
The reflection of fixed assets on the balance sheet indicates the commercial viability and reliability of the company.
Liquidity ratios: types, meaning, interpretation
The calculation of liquidity ratios is carried out in order to obtain characteristics of a legal entity’s ability to fulfill all its obligations at the expense of everything it owns.
The purpose of liquidity indicators is to compare the value of an enterprise's assets with the amount of short-term debts at the same date. In other words, each liquidity ratio shows how much of the existing short-term debt could be covered by selling each set of assets.
The property owned by a business entity can be divided into 3 categories depending on the possible speed of its sale. Based on this gradation, 3 liquidity indicators were introduced:
- Quickly realizable assets (money, short-term investments). The absolute liquidity ratio is calculated from their value.
- Assets that are sold fairly quickly (accounts receivable with a short repayment period). The average liquidity indicator is calculated from the amount of quickly sold and fairly quickly sold assets.
- Relatively quickly realizable assets (company inventories). The value of the total liquidity indicator is calculated from the total value of all current assets.
So, liquidity ratios are designed to demonstrate the following points:
- The current liquidity ratio shows how many rubles of current assets are per 1 ruble of current liabilities.
- The absolute liquidity ratio shows what proportion of a firm's short-term debt can be repaid with cash and cash equivalents in the form of marketable securities and deposits.
- The total liquidity ratio shows whether current debts can be repaid through the sale of current assets.
To summarize, the calculation of liquidity ratios is necessary for analysts who want to get an idea of the company's ability to repay its debts in a time-bound manner. An expert who has such data can find out whether the enterprise under study is solvent, what is the dynamics of its solvency in retrospect, and what are the forecasts for this organization .
Total assets in the analysis of company activities
Based on information about the gross amount of assets, an analysis of work in the company is built, for which the necessary indicators are calculated. For example, the size of the company's total capital.
Total capital is the sum of all types of capital involved by the company in the production process - its own and borrowed capital, and of these, working capital and invested capital.
Based on information about the gross size of assets, the analyst can calculate the size of:
SC = SA (line 1600) – (DO (long-term loans, line 1400) + KO (short-term liabilities, line 1500));
OK = OA (current assets line 1200) – KO (line 1500);
IR = SA (p. 1600) – KO (p. 1500).
In the balance sheet, total capital is found using the formula:
SK = page 1370 + page 1400 + page 1500
Total assets in the balance sheet (line 1600) is an absolute indicator on the basis of which values are calculated that characterize the degree of efficiency in the use of the company’s property. One of them is the indicator of profitability (profitability) of the SA. This ratio reflects the amount of net profit per unit of capital value (all available resources from various sources) and is calculated by the formula:
Krsa = PE / SA, where PE is net profit.
According to reporting forms, the profitability index is calculated as follows:
Krsa = line 2300 of the financial results report / (line 1600 at the beginning of the year + line 1600 at the end of the year) / 2
The increase in CA profitability may be associated with:
with an increase in the company's net profit;
with an increase in tariffs for the services/goods offered, or a decrease in production costs;
with an increase in SA turnover.
A decrease in the coefficient signals reverse processes occurring in the analyzed period. CA profitability tells the economist whether a company has a strong foundation that provides a good return on equity. Typically, firms that do not achieve fairly high SA profitability indicators cannot ensure a sufficient level of SA profitability and are forced to take appropriate measures, including changing their business strategy.
How to calculate the liquidity indicators of an enterprise using general formulas and the balance sheet
For each liquidity indicator, the following statement is true: the liquidity ratio is calculated as the ratio of the cost of a certain type of property (according to the classification according to the period of sale) to the amount of short-term liabilities. Information for carrying out calculations can be found in the company’s balance sheet (usually for this purpose an aggregated form is compiled - enlarged, generalized).
Important! Information on current liabilities can be determined as a result of Section V, but only if provisions and deferred income are not material, they are not actually debt.
If the values of estimated liabilities and the amount of future income on the balance sheet take on significant values, in the formulas for calculating indicators, the amount of debts to creditors and obligations on borrowed funds, taken according to the lines of Section V, should be used:
| General formula | Balance formula |
Results
The amount of fixed capital at residual value consists of the indicators of the lines of the 1st section of the balance sheet “Non-current assets”, namely: 1110, 1120, 1130, 1140, 1150, 1160, 1170, 1190. The result obtained differs from the data in the final line 1100 by the amount deferred tax assets, since this asset is not included in fixed assets.
You can find more complete information on the topic in ConsultantPlus. Free trial access to the system for 2 days.
Calculation of liquidity indicators (current liquidity)
The current liquidity ratio (coverage ratio, total liquidity ratio, CR - current ratio) is a financial indicator that reflects the company’s ability to pay off short-term debts by selling its current assets (all or only some). By the value of the current liquidity indicator, you can determine whether the organization is solvent.
The total liquidity indicator is calculated as the ratio of the company’s current assets and its current debts:
Important! From the amount of current assets participating in the formula presented above, it is necessary to exclude long-term accounts receivable (it was indicated in the Balance Sheet until 2011).
The economic interpretation of current ratio values is quite simple:
- the value of the indicator within the interval 1.5-2.5 is considered normative in world practice (varies depending on the field of activity);
- for enterprises in the Russian Federation, the normative value is CR>2;
- if CR>3, this most often indicates that the company’s managers are irrationally structuring the enterprise’s capital;
- a coefficient value of less than 1 indicates the presence of a large financial risk, because the company is unable to repay its debts consistently.
How I do balance sheet analysis: part 2
This is a continuation. Start here. We continue to study the balance sheet. Previously, we figured out what assets are and what their changes indicate. Now let's move on to considering non-current assets (Non-current Assets) and balance sheet liabilities.
Non-current Assets
Non-current or permanent assets are assets whose useful life is more than 12 months. They represent the company's fixed capital and are accounted for on the balance sheet at historical cost, that is, at the acquisition price, or in the case of intangible assets, at cost. The composition of Non-current Assets on the balance sheet includes:
- Long Term Investments: investments in long-term securities (more than 1 year) and in the business of other companies.
- Property Plant and Equipment: buildings, structures, land, equipment.
- Goodwill (Goodwill): business connections and company reputation.
- Intangible Assets: patents, know-how, trademarks, licenses.
- Accumulated Amortization: The amount of depreciation of fixed assets and intangible assets.
- Other Assets.
- Deferred Long Term Asset Charges: Expenses already incurred that will benefit in the future, as well as expenses that must be allocated to future periods, such as property taxes, pension payments, lease payments, issue of debt obligations, etc.
Using the example of the balance sheet of Intel Corp. its non-current assets look like this.
Non-current assets on the balance sheet, Intel Corp. report.
on Yahoo! Finance An increase in non-current assets most often indicates the company's acquisition of fixed assets or long-term investments. This could be buildings, land, equipment, transport or construction investments. In such cases, I always try to understand whose money - my own or borrowed - was used to make it. The attraction of external capital is indicated by the growth of balance sheet liability items: Long Term Debt and Other Liabilities.
Liabilities on the balance sheet, Intel Corp. report. on Yahoo! Finance A decrease in the value of non-current assets in the balance sheet may indicate the sale of fixed assets (in American accounting, revaluation of fixed assets is not allowed) or their depreciation, the accrual of which is indicated by an increase in the accumulated depreciation item (Accumulated Amortization). Taking into account the fact that fixed assets require long-term investments, the source of which should be own (and only partially borrowed) funds, I always correlate the amount of non-current assets with the amount of equity capital (Stockholders' Equity).
- Conclusion 9: The more non-current assets a company has, the more resources are needed to maintain them and the higher the share of equity capital should be.
In accounting, nothing arises on its own, but appears due to something. And simultaneously with the assets, the sources of their formation are displayed on the balance sheet, they are also liabilities.
Balance Liabilities
In accounting, nothing arises on its own, but appears due to something. Therefore, with the addition of assets to the balance sheet, it reflects the sources of their formation, that is, liabilities.
- This is the essence of the balance sheet and its equation: Assets = Liabilities.
In other words, liabilities are a means of acquiring assets, and these funds can be own (money from the company's owners) or borrowed (money from banks, loans from suppliers). Funds belonging to the company's shareholders are reflected on the balance sheet as Stockholders' Equity, and funds raised are reflected as liabilities (Liabilities).
- Conclusion 10: Liabilities = Liabilities + Stockholders' Equity.
Liabilities and equity in the balance sheet, Intel Corp. report.
on Yahoo! Finance Liabilities
The company's liabilities arise as a result of its debts to suppliers, employees and the state, as well as due to the attraction of loans and borrowings. They are reflected in the balance sheet in descending order of their maturity and include:
1. Current Liabilities: debt due within 12 months, including:
- Accounts Payable: debt for payments to the budget, to suppliers and personnel.
- Short/Current Long Term Debt: Short-term bond debt, bank loans and advances.
- Other Current Liabilities.
2. Non-Current Liabilities : debt repayable for a period of more than 12 months, including:.
- Long Term Debt: Long-term bond loans, bank loans and advances.
- Deferred Long Term Liability Charges: Costs incurred in the current period but related to future accounting periods, for example, prepayments on a lease, insurance payments.
- Minority Interest: Shares of a company's shareholders in affiliates and subsidiaries that do not exceed 50% and do not give them control rights.
- Negative Goodwill: The difference that arises when a company is purchased (absorbed) at a price greater than the fair value of its net assets.
Liabilities on Balance Sheet, Intel Corp. Report.
on Yahoo! Finance When analyzing the structure of liabilities (Total Liabilities), I always look at what part of them is short-term (Short Term Debt), and what part is long-term borrowing (Long Term Debt), since this affects the financial stability of the company and my investment risks. Taking into account the fact that short-term debts are repaid using current assets (the company’s working capital), the fewer there are, the better: then the money to repay them is not withdrawn from circulation.
- Conclusion 11: The greater the volume of short-term debt obligations, the higher the business’s dependence on creditors and the higher the risk of insolvency due to falling sales and reduced profits.
In turn, long-term debts are repaid using the cash flow generated by the business.
Therefore, I assess the company's ability to pay long-term debts by correlating their size with the size of net cash flow (Net Cash Flow, NCF). You can find out the volume of a company's Net Cash Flow in the Cash Flow Statement. The final line in the report Change in Cash and Cash equivalents is the value of net cash flow (Net Cash Flow, NCF). Using the example of Intel Corp. The Cash Flow Statement looks like this:
- Yahoo! Finance
- Marketwatch.com
- morningstar.com
Next, I compare the size of current liabilities (Current Liabilities) with current assets (Current Assets). Current assets must exceed current liabilities (by how much depends on the industry, usually coverage of 2 times is considered the norm). Otherwise, the company may have difficulty paying bills and running its business.
- Conclusion 12: Adequacy of working capital is a necessary condition for the normal operation of the company. It is important that the growth rate of current assets be higher than the increase in its short-term liabilities.
If current liabilities exceed current assets, this indicates a lack of working capital and the use of debt to finance working capital.
However, for some companies, such as retailers, working capital shortages are common. And when analyzing the balance sheet, I take into account the scope of the company’s work and look more at the dynamics of changes in assets and liabilities relative to each other and previous periods.
- Conclusion 13: The greater the increase in the company's current assets, the more money it needs to maintain them and the higher its need for sources of financing (own or borrowed).
Stockholders' Equity The company's equity (also known as shareholder and authorized) capital is the total amount of shareholders' investments and retained earnings accumulated by the company over the entire period of its operation.
In other words, this is the residual capital remaining at the disposal of the company after deducting all liabilities from the total of its assets, therefore it is also called net assets (Net Assets Value, NAV).
- Conclusion 14: Equity (Net Assets) = Total Assets – Total Liabilities.
The source of equity capital formation is the funds of the owners (investors, shareholders) and the net profit that the company receives from its business. The share capital includes:
- Preferred Stock (if any).
- Common Stock.
- Retained Earnings: A company's accumulated net income that can be used to grow the business and/or pay dividends.
- Treasury Stock: shares purchased by the company that do not have voting rights and do not participate in the distribution of dividends.
- Capital Surplus (Additional capital): income that arises during the operation of the company (at the time of its creation it is zero) and is generated due to the increase in the price of its shares and the difference in exchange rates.
- Other Stockholder Equity: a reserve fund created by the company for certain purposes (covering losses, repaying bonds, repurchasing shares, paying dividends on preferred shares).
Equity on balance sheet, Intel Corp. report.
on Yahoo! Finance The amount of equity capital directly depends on the result of the company’s work - profit or loss. When a company increases its income, its stock price also increases, resulting in an increase in equity items such as retained earnings and additional capital. If at the same time the volume of its shares remains unchanged, then the earnings per share (EPS) increase, and with it the profitability of the securities for the investor. A company’s repurchase of its own shares (also known as buyback and buyback) has a similar effect. Along with paying dividends, this is another way the company returns profits to investors.
You can find out whether a company has repurchased its securities from the market by changing the data in the Treasury Stock balance sheet item or by the presence of a value in parentheses in the Sale Purchase of Stock item of the Cash Flow statement Statement).
When analyzing the structure of equity capital, I pay key attention to retained earnings. First of all, because for the company this is an internal source of financing and a resource for paying dividends (if the retained earnings are negative, the company does not have the right to pay dividends).
An effective business must increase its capital. A decrease in equity capital indicates that the company is spending more than it earns, i.e. eats up all the profits. There may be three reasons for this: 1. The company is suffering losses. 2. Conducts restructuring. 3. Makes large-scale investments. To understand what exactly happened, I look at the Income Statement and Cash Flow Statement. I will definitely tell you how to analyze them in the following reviews.
- Conclusion 15: For the successful operation of the company and its financial stability, the share of equity capital in relation to the volume of assets must be above 50%, and its growth rate must exceed the increase in liabilities.
A negative value (shown in the report in parentheses) of equity is an alarming signal, meaning the company lacks its own funds and is completely dependent on sources of external financing.
Buying shares in such a company means taking on a prohibitively high risk, which I do not do and do not advise you to do. Choose companies without debt for investment - they will not go bankrupt. And always pay attention to the value of her tangible assets. Net Tangible Assets At the very bottom of the balance sheet there is a line called Net Tangible Assets, which represents the value of net tangible assets. To me, as an investor, it is interesting because, unlike net assets, it gives a more conservative assessment of what a company is worth, because its calculation takes into account only tangible assets:
- Net Tangible Assets = Total Assets – Total Liabilities – (Goodwill) – Intangible Assets
I use Net Tangible Assets along with the Price/Book (P/B) ratio to evaluate a company's attractiveness as an investment and weigh my investment risks.
You can do the same. In the next (final) part of the review, I will talk about how to distinguish a good balance sheet from a bad one, as well as how to calculate some of the ratios and check the company for financial strength.
Oksana Gafaiti, author of MindSpace.ru, private investor. Go Invest - invest with me.
Calculation of liquidity indicators (quick liquidity)
Quick liquidity ratio (quick liquidity ratio, intermediate liquidity ratio, QR - quick ratio) is a financial indicator that reflects the ability of an enterprise to repay all existing current obligations in a situation where, for some reason, it was not possible to sell manufactured products.
This indicator is calculated as the quotient of highly liquid current assets and current liabilities (liabilities with a short deadline):
Important! Unlike the case with the calculation of the current liquidity ratio, when calculating the quick liquidity indicator in the composition of assets, inventories (inventories) are not taken into account, since if they are sold due to the great need for cash, in comparison with other working capital they will be maximum losses for the company.
If the value of the quick liquidity ratio turns out to be equal to one or greater than 1, this is a good sign.
The concept of return on total capital
All investments can be formed from two sources: equity capital and borrowed capital. For this reason, there are two coefficients by which return on total capital is determined:
- return on equity (ROE),
- return on borrowed capital (ROCE).
Return on capital owned by an organization reflects the effectiveness of investing funds in the functioning of the company.
The return on employed (borrowed) capital formula reflects the effectiveness of investments in the organization's work, both own and borrowed funds. Using this indicator, management can determine the degree of efficiency of using its own capital and raised funds in its activities in the long term (for example, investments).
Calculation of liquidity indicators (absolute liquidity)
The absolute liquidity ratio is an economic indicator that has not found recognition in the West, showing whether an enterprise is solvent or not, namely, whether the company is able to pay off debts whose maturity is less than 1 year.
The absolute liquidity indicator is calculated by dividing the amount of funds available to the company and financial investments made for a short period by the amount of all obligations with a short deadline:
Important! As part of the assets participating in the above formula for calculating absolute liquidity, only money and assets that are close in nature to cash are subject to accounting.
Based on information from regulations relating to Russian enterprises, the standard value of the absolute liquidity indicator is a value of 0.2 and above.
Return on total capital value
The value of return on total capital is influenced by the size of profit, as well as the ratio between liabilities and own resources. This ratio can be determined by the ratio of liabilities to capital (the “financial leverage” of the enterprise).
In the process of increasing obligations and increasing costs of servicing them, the company's management thus reduces profits and profitability.
The return on total capital formula is used in the capital comparison process:
- with similar indicators of other enterprises,
- with interest on bank deposits and the yield of government securities.
If the return on capital is less than the interest on the deposit (bonds) for the same time period, then investing in the project will not make sense. The optimal excess of profitability over these indicators is several times.
Standard values of liquidity indicators: economic interpretation
Let's consider what the standard values of each of the liquidity ratios of organizations are, and how to correctly interpret them:
| Liquidity ratio | Normative value | Economic interpretation |
| Total liquidity ratio | Greater than or equal to 1, but not much greater than 1. | A value equal to 1 or slightly greater than 1 indicates that short-term debts can be repaid after the sale of current assets. If the value is significantly higher than 1, the company's owners are using available working capital ineffectively. |
| Absolute liquidity ratio | From 0.2 to 0.5. | If the value of the indicator is within the specified limits, it means that the owner can repay 20-50% of short-term debts in a short time. |
| Quick liquidity ratio | From 0.7 to 1. | The company has the ability to quickly pay off 70-100% of short-term debts. |
How to parse values
RA is an important tool not only for analysts and financiers who calculate indicators for the effective increase in capital and profit in a company, but also for accountants. A correctly calculated coefficient shows the real current financial condition of the enterprise, which is the most valuable information for inspection authorities (Order of the Federal Tax Service No. MM-3-06 / [email protected] dated May 30, 2007). The standard value for the RA index is greater than zero. Deviation from the norm is established for each industry separately (clause 4 of the Order of the Federal Tax Service No. MM-3-06 / [email protected] dated May 30, 2007). However, as a general rule, it is considered that a deviation exceeding the average industry standard by 10% or more is critical, that is, the financial and economic activities of the institution are problematic and are at a loss.
An example of calculating liquidity indicators of an enterprise
Let’s imagine that we know some data from the Balance Sheet of a hypothetical LLC “The Prince and the Pauper”:
| Balance sheet data | Amount (rubles) |
| Fixed Assets (Fixed Assets) | 376 000 |
| Cash (DC) | 171 000 |
| Intangible assets (IMA) | 145 000 |
| Inventory (Inventory) | 269 000 |
| Accounts receivable (RE) | 231 000 |
| Short-term financial investments (SFI) | 138 000 |
| Short-term loans (CC) | 204 000 |
| Long-term loans (LC) | 216 000 |
| Long-term loans (DoZ) | 291 000 |
Let's calculate the liquidity indicators of Prince and the Pauper LLC:
| Liquidity ratio | Calculation formula | Interpretation of values |
| Absolute liquidity ratio | K1 = (171 + 138) : (216 + 204) = 0.7357 | A value of more than 0.2 is considered normal. The company will be able to cover 73% of its debts using existing cash in its accounts. |
| Quick liquidity ratio | K2 = (171 + 138 + 231) : (216 + 204) = 1.2857 | The value must be at least 0.8. If the company decides to use all its funds, including accounts receivable, this amount will be 1.28 times the total amount of debts. |
| Critical liquidity ratio | K3 = (171 + 138 + 231 + 269) : (216 + 204) = 1.9261 | The value is much higher than 1, which means that the company is probably not managing its working capital wisely. |
Structure of fixed capital
The fixed capital (FCC) of the enterprise is formed by:
- Fixed assets are property directly or indirectly used to produce products, provide services, or perform work. The group of fixed assets includes buildings, equipment, machinery, transport, livestock, inventory, land, etc. (clause 5 of PBU 6/01).
- Construction in progress - costs for the construction of facilities, installation of equipment, as well as the purchase of equipment, inventory and other capital costs (clause 3 of the Regulations on accounting for long-term investments, approved by letter of the Ministry of Finance of the Russian Federation dated December 30, 1993 No. 160).
- Financial investments - securities, purchased receivables, contributions to the authorized capital of third-party organizations, etc. (clause 3 of PBU 19/02).
- Intangible assets are a documented ownership right to the result of intellectual activity or a means of individualization (clauses 4, 5 of PBU 14/2007).
Answers to frequently asked questions about calculating liquidity ratios
Question: What liquidity indicator most accurately characterizes the degree of solvency of a company that is part of a holding group?
Answer: It is advisable to identify the level of solvency based on the values of the absolute liquidity indicator. At the same time, when calculating the value of the liquidity ratio, it is not necessary to take into account the amounts of internal receivables and payables.
Question: Are illiquid inventories taken into account when calculating the current ratio?
Answer: No, illiquid inventories should not be taken into account.